QUESTION IMAGE
Question
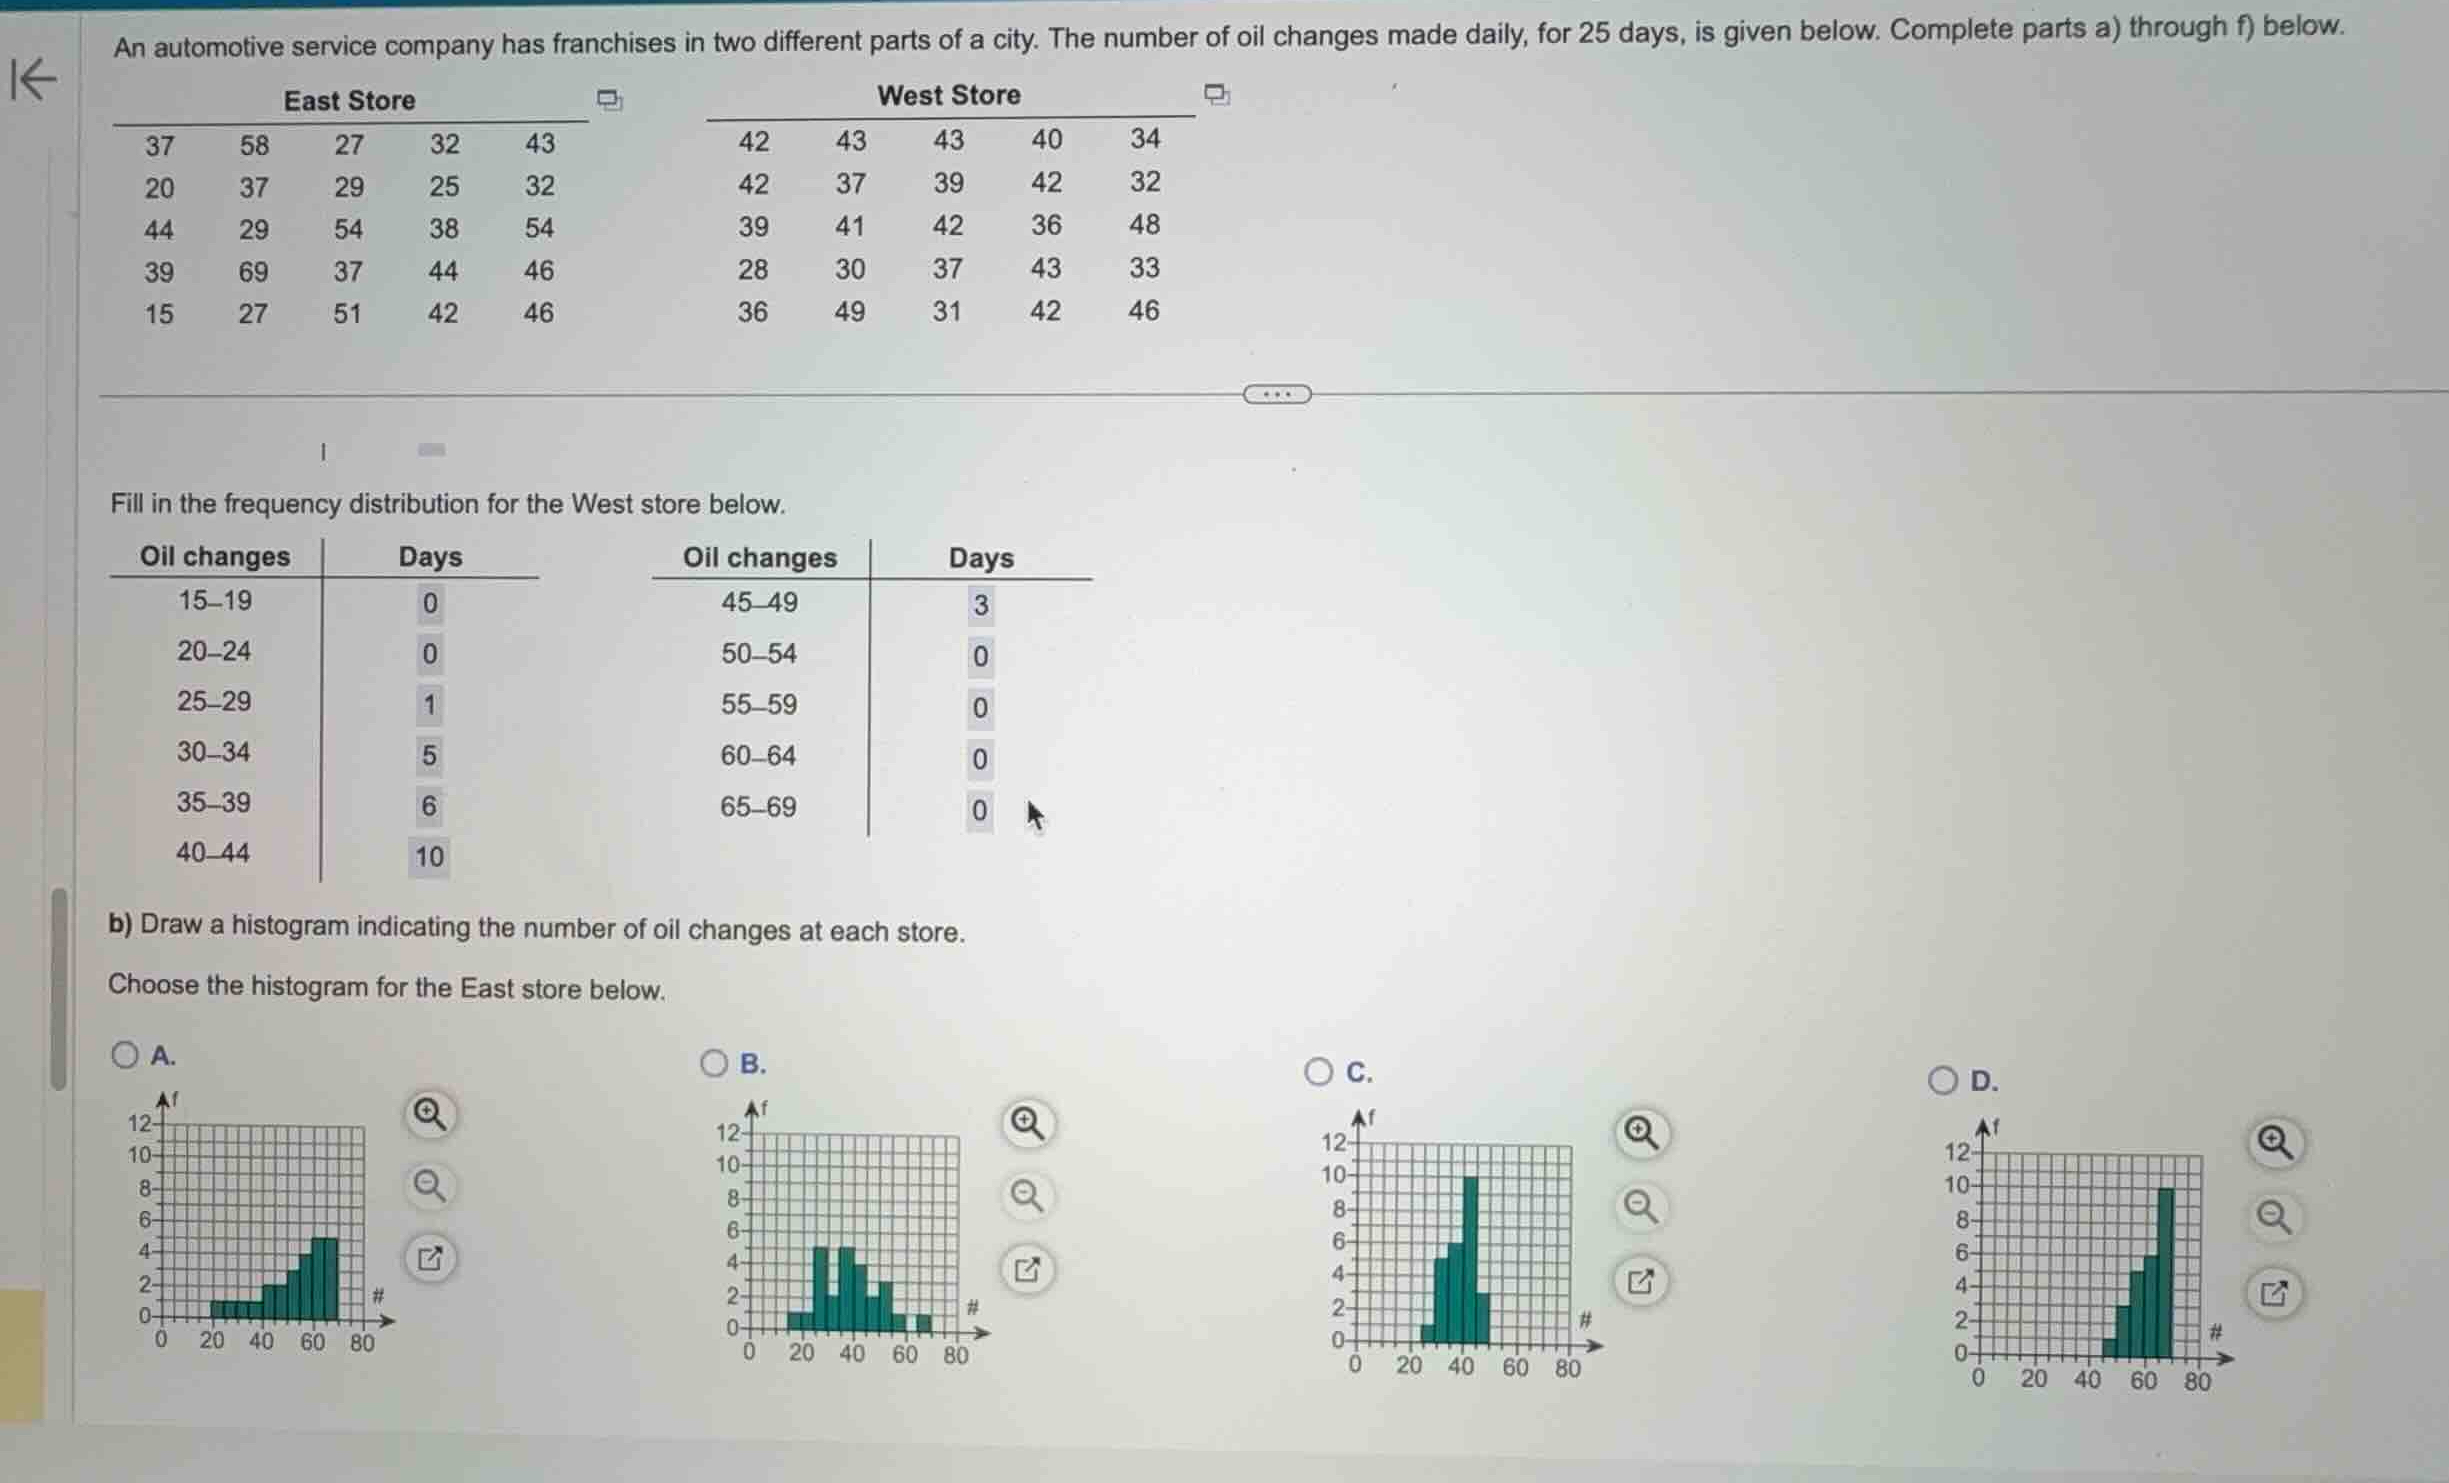
an automotive service company has franchises in two different parts of a city. the number of oil changes made daily, for 25 days, is given below. complete parts a) through f) below.
east store
37 58 27 32 43
20 37 29 25 32
44 29 54 38 54
39 69 37 44 46
15 27 51 42 46
west store
42 43 43 40 34
42 37 39 42 32
39 41 42 36 48
28 30 37 43 33
36 49 31 42 46
fill in the frequency distribution for the west store below.
oil changes | days
15-19 | 0
20-24 | 0
25-29 | 1
30-34 | 5
35-39 | 6
40-44 | 10
45-49 | 3
50-54 | 0
55-59 | 0
60-64 | 0
65-69 | 0
b) draw a histogram indicating the number of oil changes at each store.
choose the histogram for the east store below.
Tally the East Store data
Using the Frequency Distribution knowledge point
We count the occurrences of daily oil changes for the East Store in each class interval:
- 15–19: 15 (1 value) $
ightarrow$ Frequency = 1
- 20–24: 20 (1 value) $
ightarrow$ Frequency = 1
- 25–29: 27, 29, 27 (3 values) $
ightarrow$ Frequency = 3
- 30–34: 32, 32 (2 values) $
ightarrow$ Frequency = 2
- 35–39: 37, 37, 38, 39, 37 (5 values) $
ightarrow$ Frequency = 5
- 40–44: 43, 44, 44, 42 (4 values) $
ightarrow$ Frequency = 4
- 45–49: 46, 46 (2 values) $
ightarrow$ Frequency = 2
- 50–54: 54, 54, 51 (3 values) $
ightarrow$ Frequency = 3
- 55–59: 58 (1 value) $
ightarrow$ Frequency = 1
- 60–64: None (0 values) $
ightarrow$ Frequency = 0
- 65–69: 69 (1 value) $
ightarrow$ Frequency = 1
Match frequencies to histogram options
Using the Histogram Interpretation knowledge point
We compare our calculated frequencies for the East Store with the given options:
- Option A: Shows bars starting at 15 with heights increasing towards the right, peaking near 60–70. This does not match.
- Option B: Shows bars peaking in the 20–40 range. This does not match.
- Option C: Shows bars concentrated tightly around 30–40. This does not match.
- Option D: Let's check the bar heights:
- 15–19: height 1
- 20–24: height 1
- 25–29: height 3
- 30–34: height 2
- 35–39: height 5
- 40–44: height 4
- 45–49: height 2
- 50–54: height 3
- 55–59: height 1
- 60–64: height 0
- 65–69: height 1
This perfectly matches our tallied distribution.

Snap & solve any problem in the app
Get step-by-step solutions on Sovi AI
Photo-based solutions with guided steps
Explore more problems and detailed explanations
- (A)
- (B)
- (C)
- (D) (Correct answer)