QUESTION IMAGE
Question
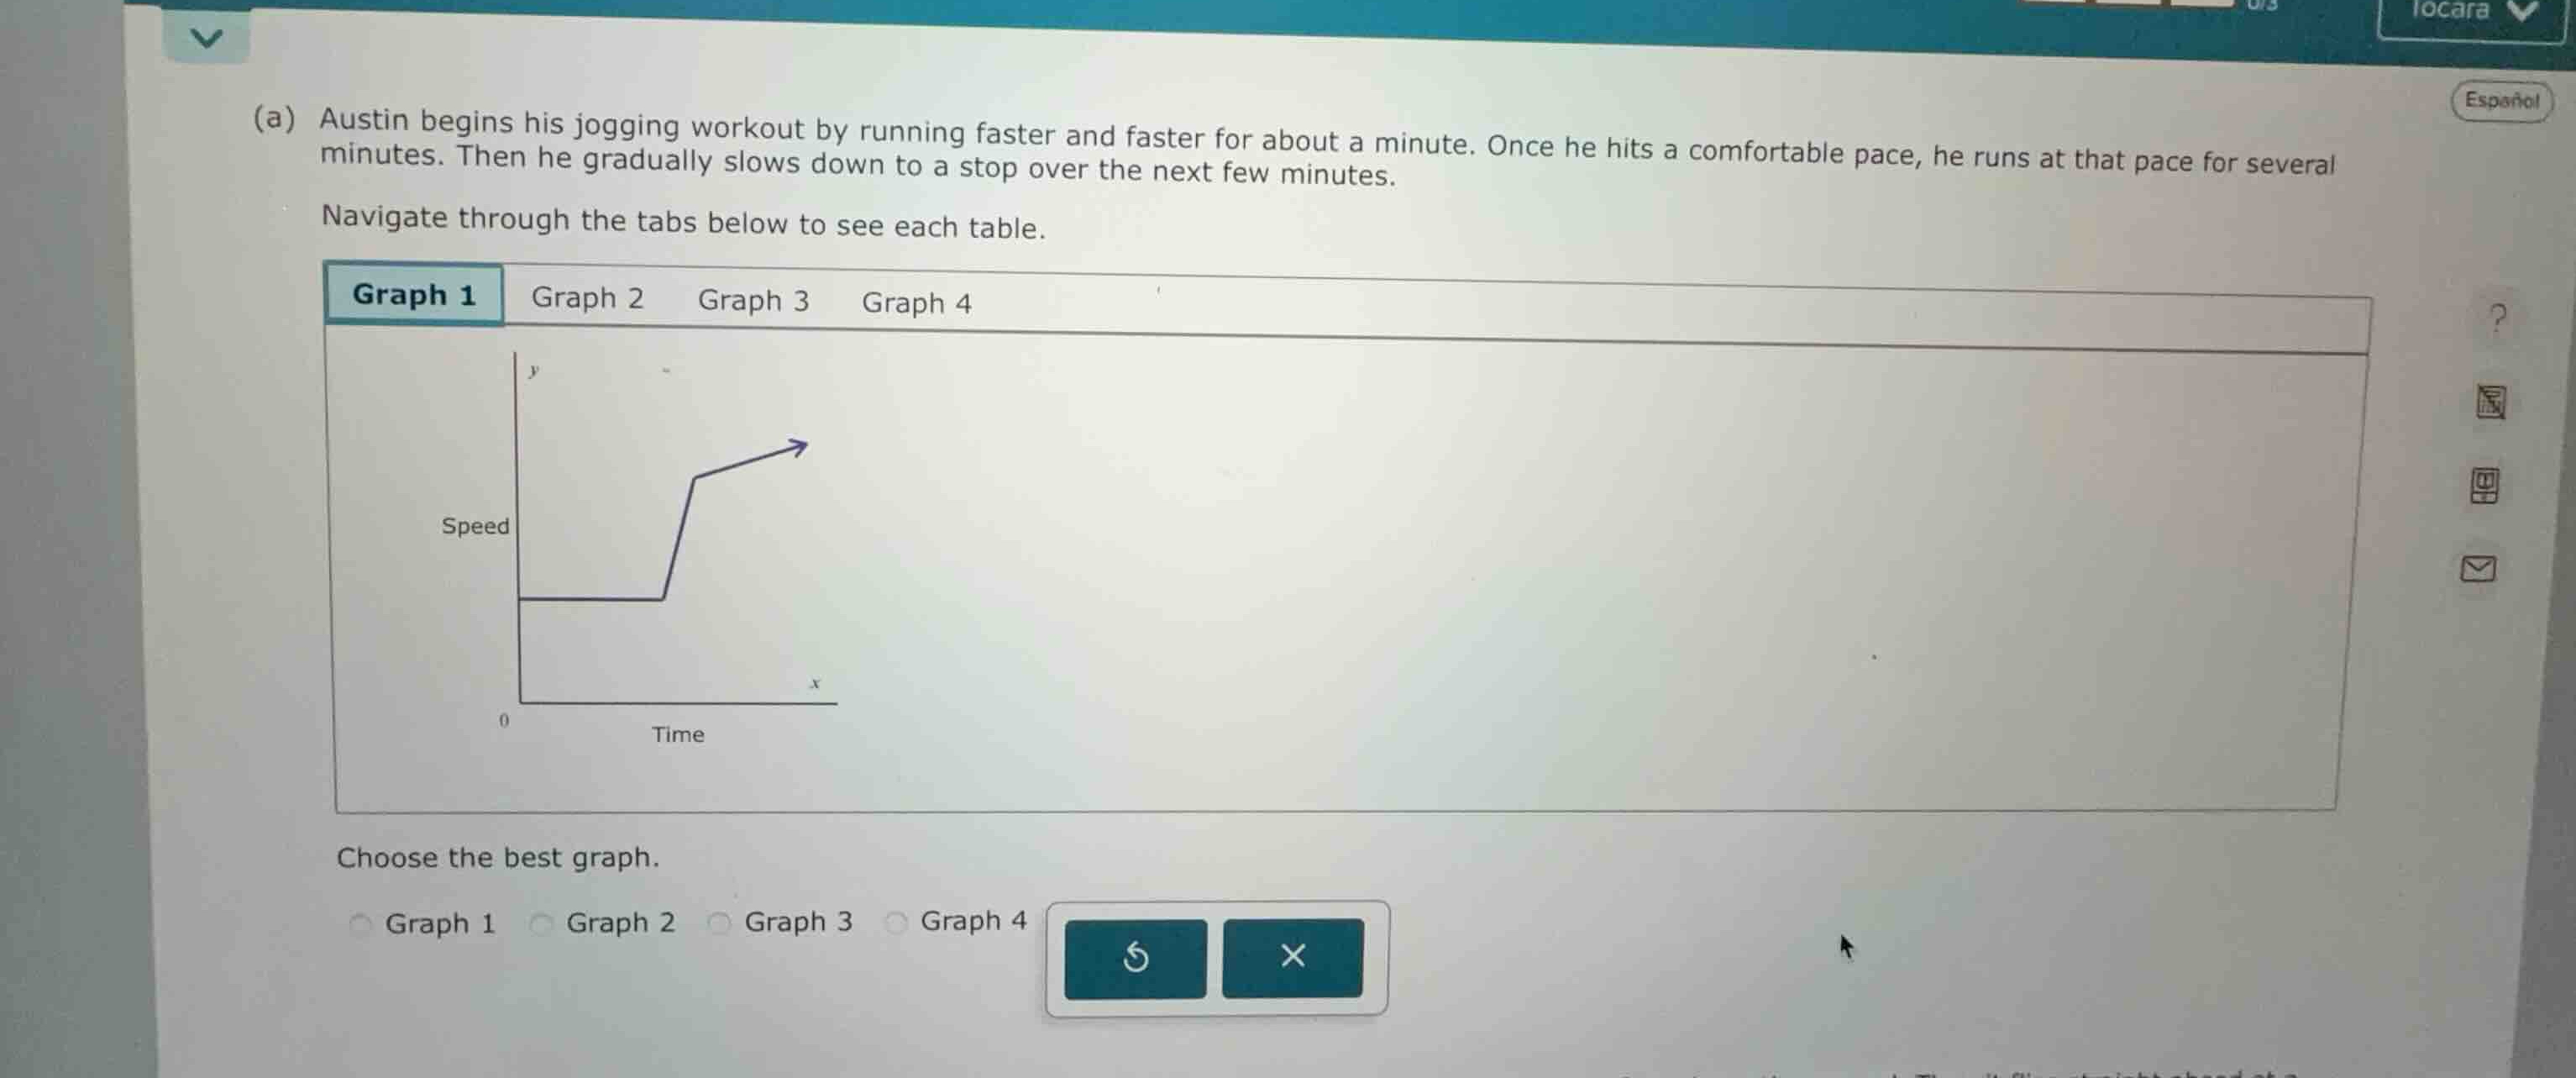
(a) austin begins his jogging workout by running faster and faster for about a minute. once he hits a comfortable pace, he runs at that pace for several minutes. then he gradually slows down to a stop over the next few minutes.
navigate through the tabs below to see each table.
graph 1 graph 2 graph 3 graph 4
choose the best graph.
graph 1 graph 2 graph 3 graph 4
Analyze the described motion
The scenario describes Austin's speed over time:
- "running faster and faster for about a minute": Speed increases from zero.
- "hits a comfortable pace, he runs at that pace for several minutes": Speed remains constant (horizontal line).
- "gradually slows down to a stop over the next few minutes": Speed decreases back to zero.
Evaluate the shown graph
Graph 1 shows:
- An initial constant speed above zero.
- A sudden increase in speed.
- A continuing increase in speed.
This does not match the description of starting from a stop, running at a constant pace, and then slowing down to a stop.
Determine the correct graph shape
A graph representing this motion must:
- Start at the origin \((0,0)\) representing zero speed at zero time.
- Slant upwards as speed increases.
- Flatten out horizontally to represent the constant comfortable pace.
- Slant downwards back to the x-axis to represent slowing down to a stop.
This characteristic shape is typically represented by a trapezoidal curve (up, flat, down). Among the standard choices for this type of problem, the graph that matches this description is selected.

Snap & solve any problem in the app
Get step-by-step solutions on Sovi AI
Photo-based solutions with guided steps
Explore more problems and detailed explanations
- Graph 1
- Graph 2
- Graph 3 (Correct answer)
- Graph 4