QUESTION IMAGE
Question
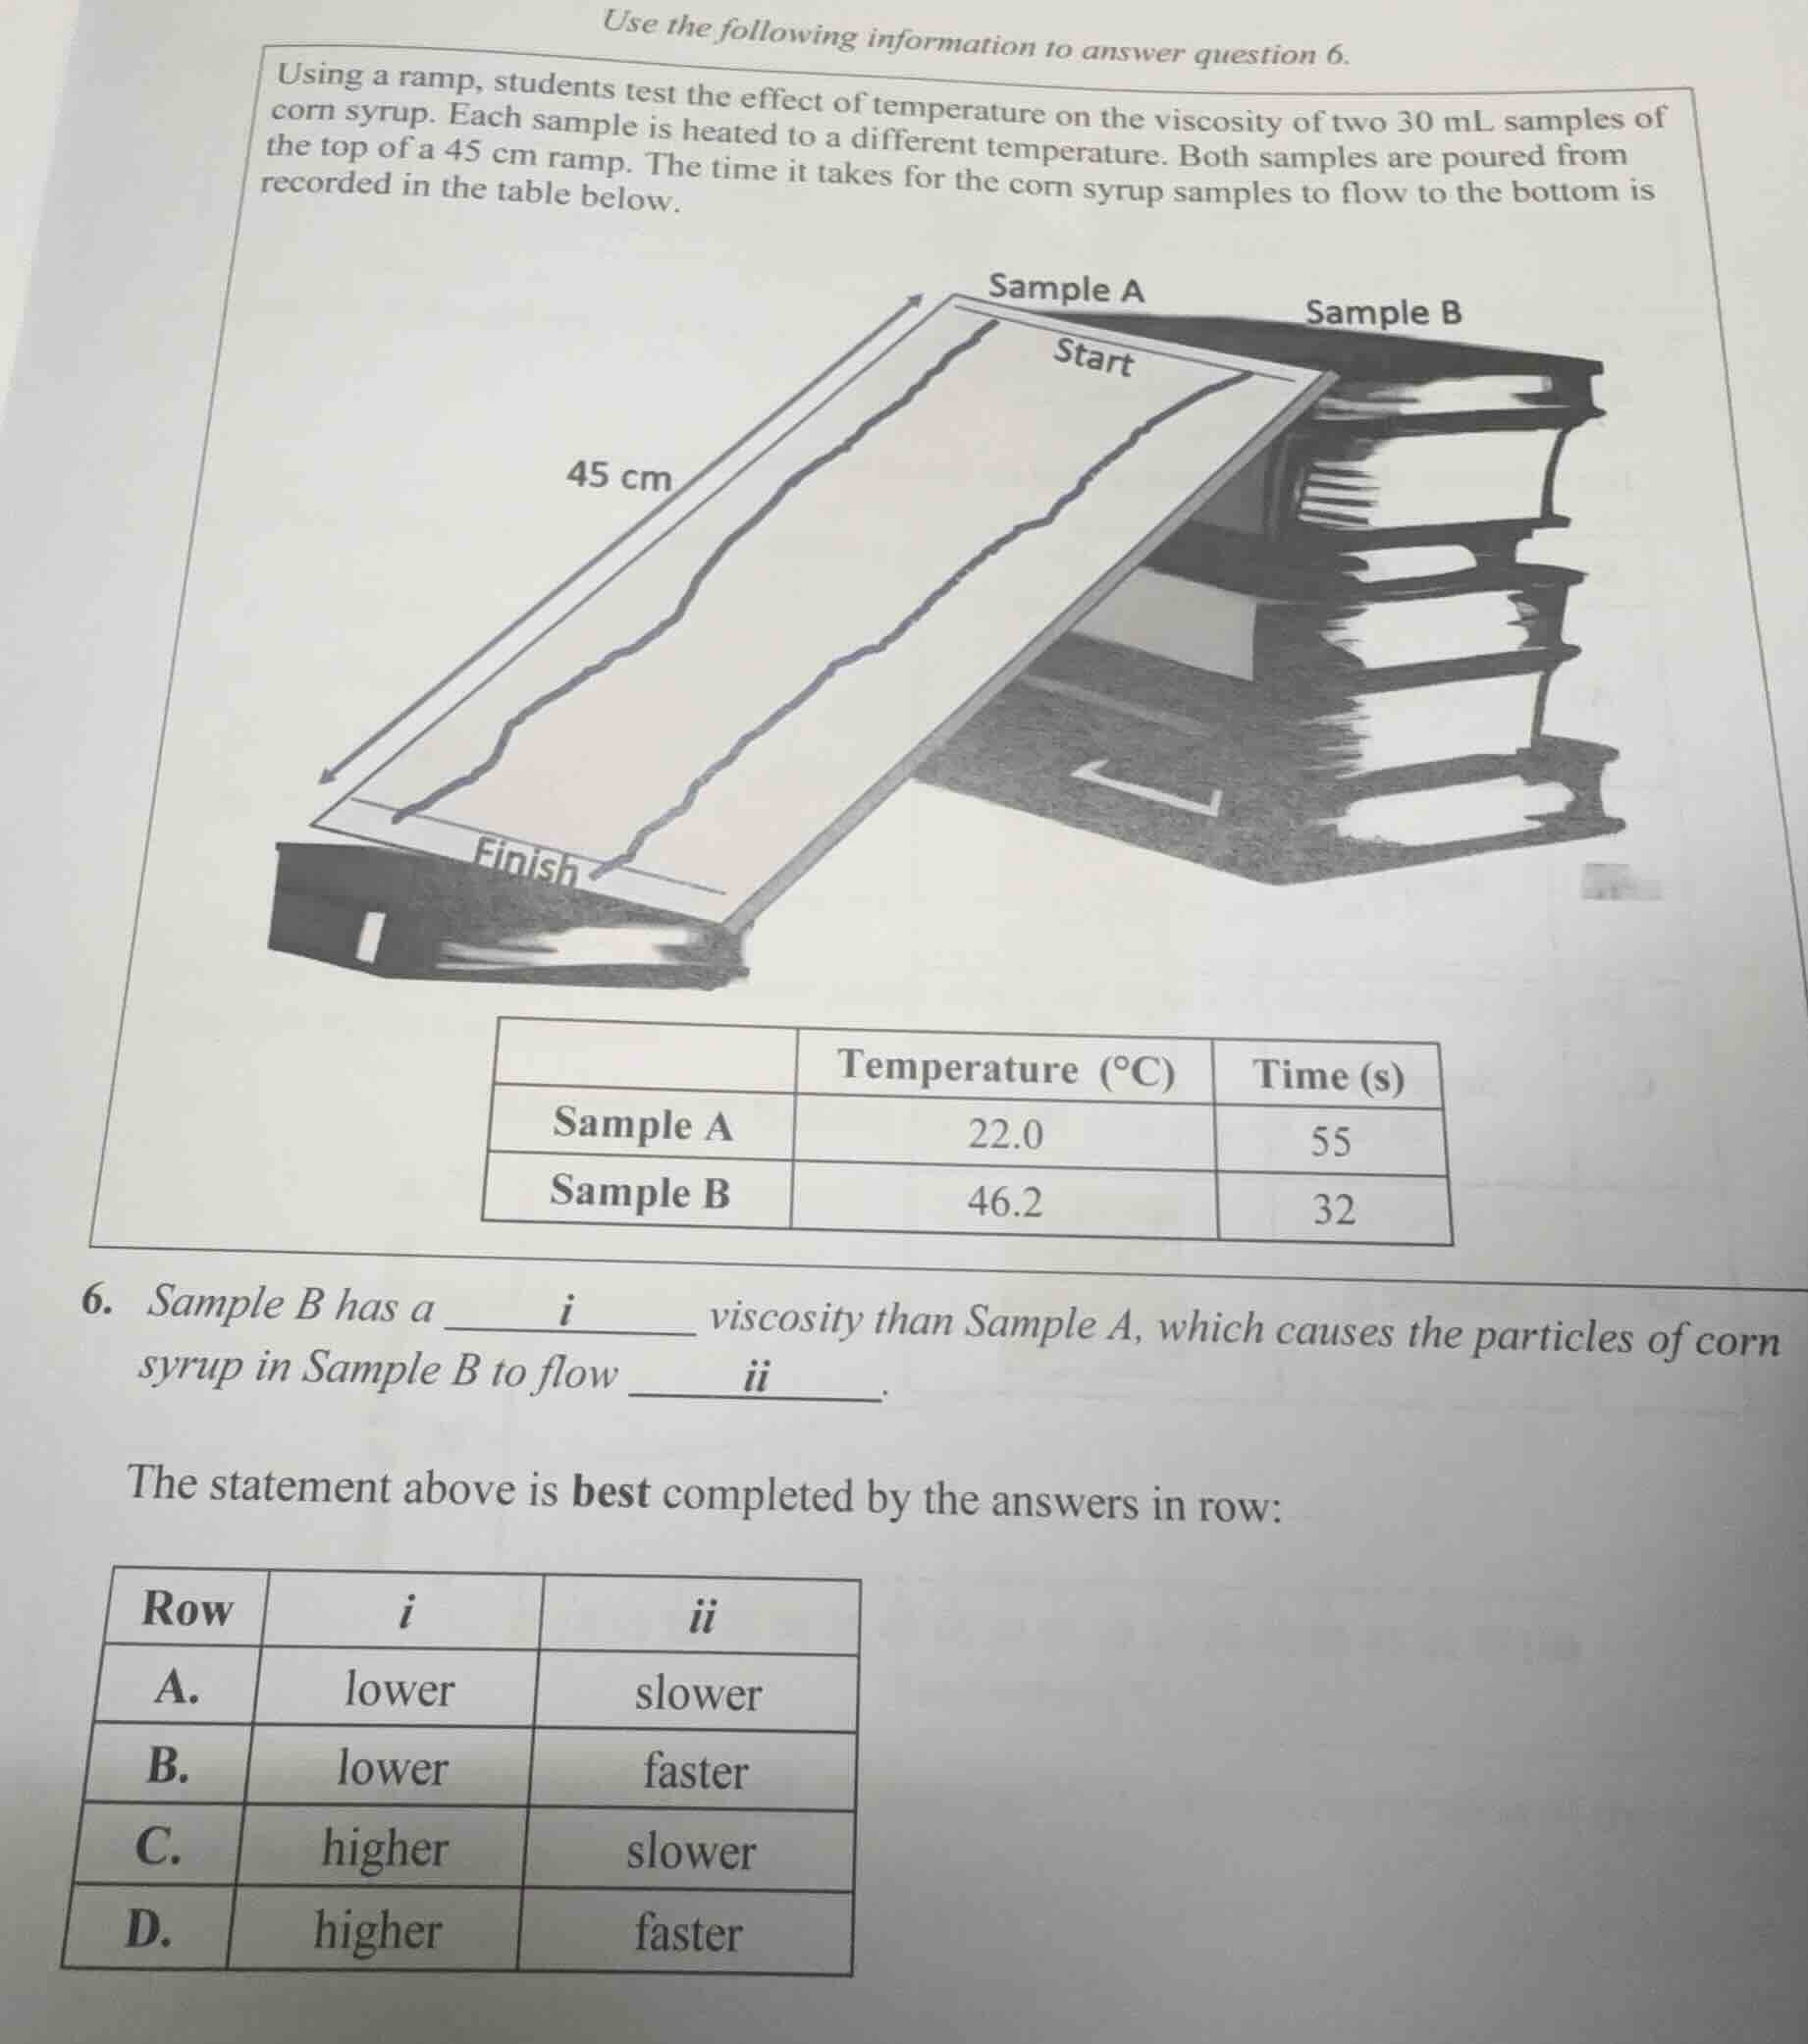
use the following information to answer question 6.
using a ramp, students test the effect of temperature on the viscosity of two 30 ml samples of corn syrup. each sample is heated to a different temperature. both samples are poured from the top of a 45 cm ramp. the time it takes for the corn syrup samples to flow to the bottom is recorded in the table below.
\
$$\begin{tabular}{|c|c|c|}
\\hline
& temperature (\\(^{\\circ}\\text{c}\\)) & time (s) \\\\
\\hline
sample a & 22.0 & 55 \\\\
\\hline
sample b & 46.2 & 32 \\\\
\\hline
\\end{tabular}$$
- sample b has a \\(i\\) viscosity than sample a, which causes the particles of corn syrup in sample b to flow \\(ii\\).
the statement above is best completed by the answers in row:
\
$$\begin{tabular}{|c|c|c|}
\\hline
row & \\(i\\) & \\(ii\\) \\\\
\\hline
a. & lower & slower \\\\
\\hline
b. & lower & faster \\\\
\\hline
c. & higher & slower \\\\
\\hline
d. & higher & faster \\\\
\\hline
\\end{tabular}$$
Analyze the experimental data
Using the Viscosity knowledge point
$$
LATEXBLOCK0
$$
Compare flow times and viscosity
Using the Viscosity knowledge point
$$
LATEXBLOCK1
$$
Match the blanks to the options
Using the Viscosity knowledge point
$$
LATEXBLOCK2
$$

Snap & solve any problem in the app
Get step-by-step solutions on Sovi AI
Photo-based solutions with guided steps
Explore more problems and detailed explanations
- A. Row A (lower, slower)
- B. Row B (lower, faster) (Correct answer)
- C. Row C (higher, slower)
- D. Row D (higher, faster)