QUESTION IMAGE
Question
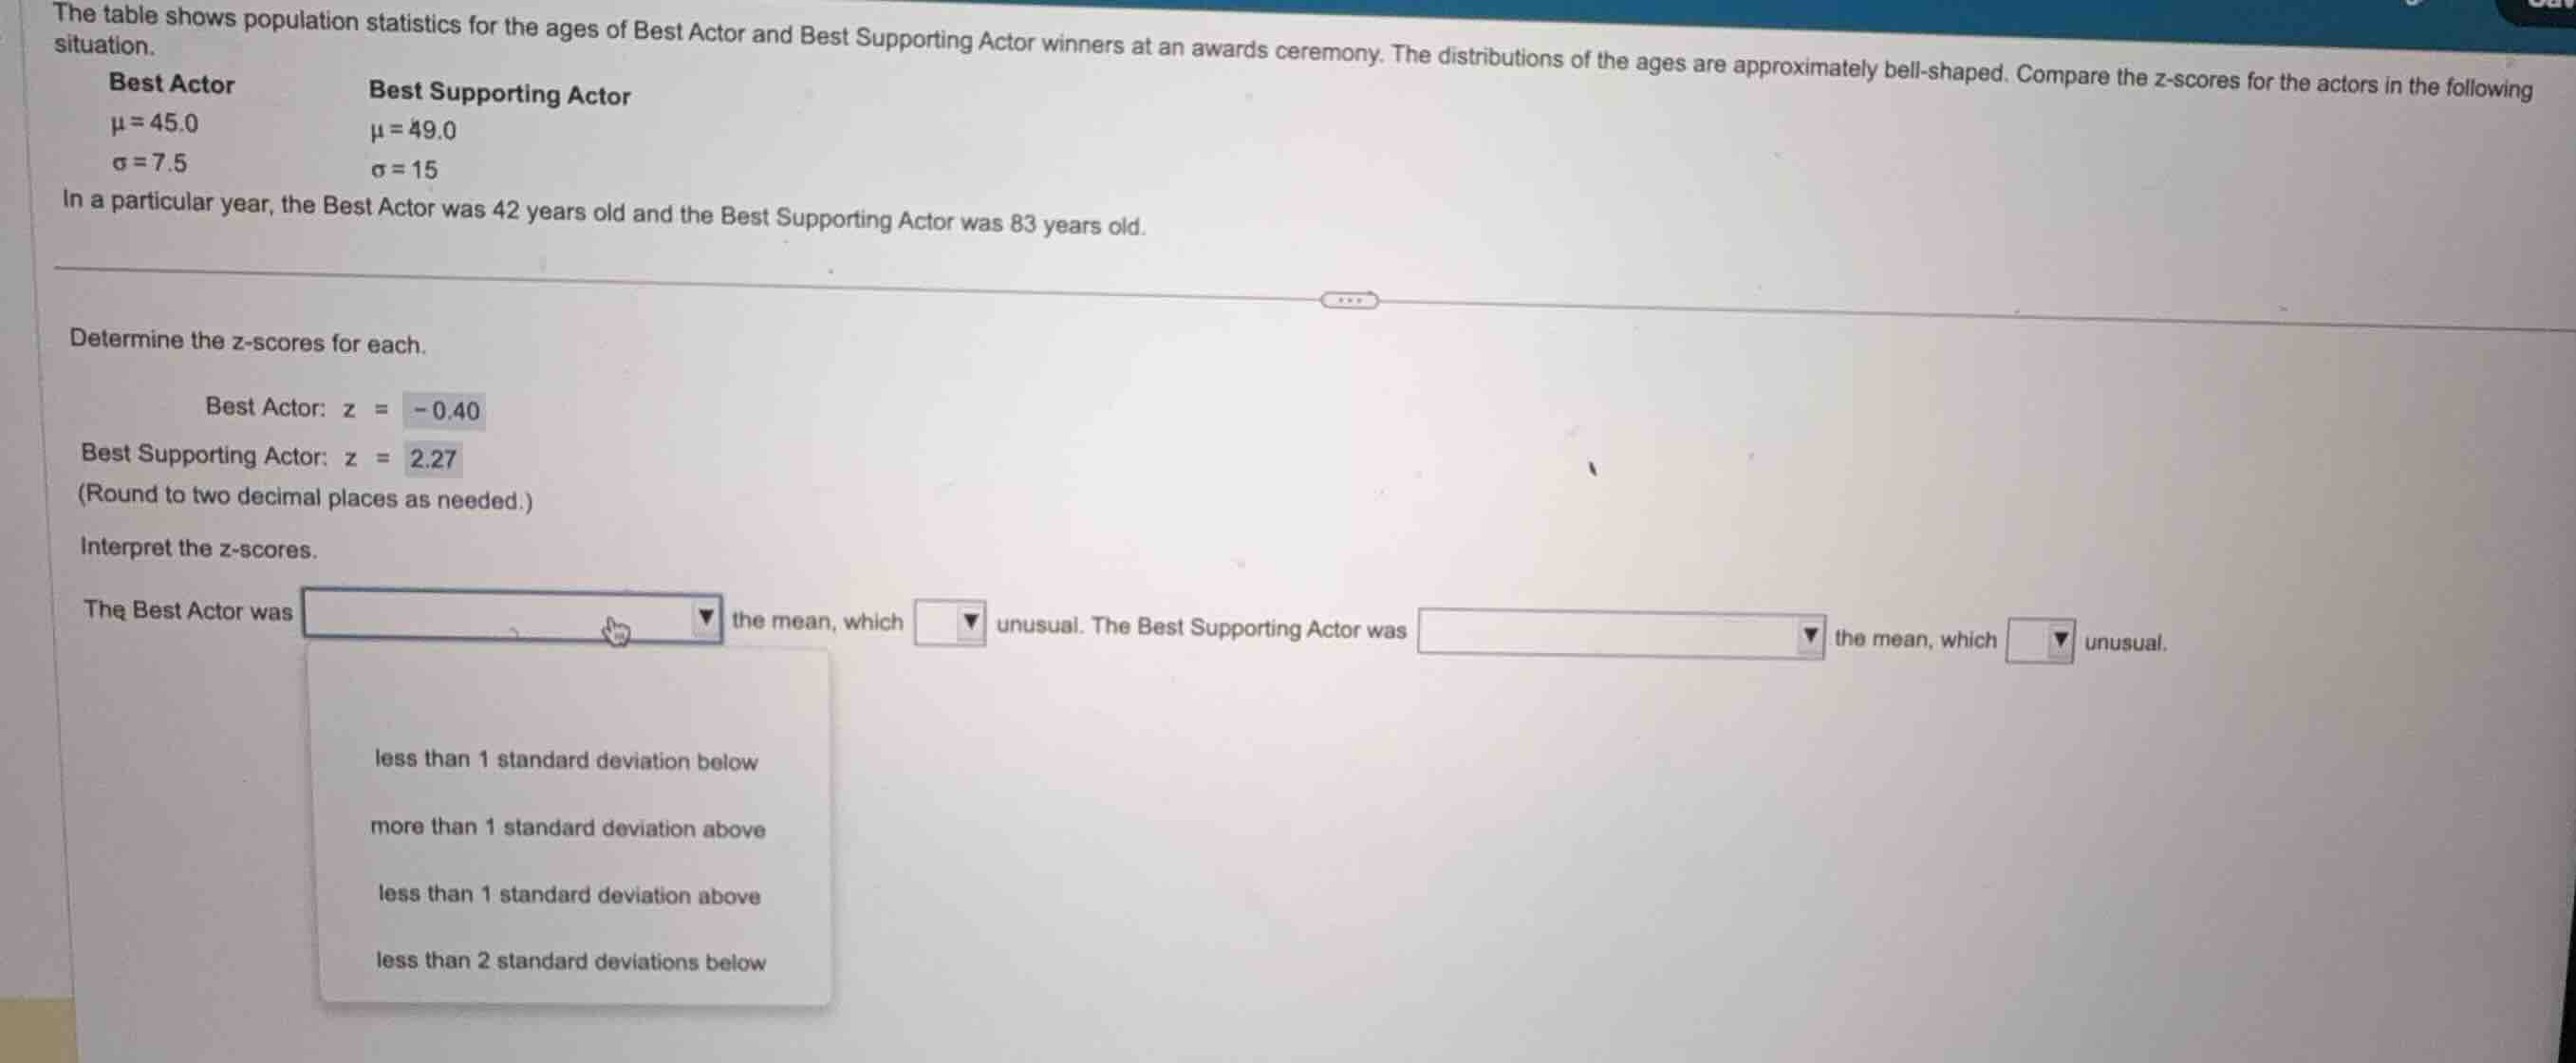
the table shows population statistics for the ages of best actor and best supporting actor winners at an awards ceremony. the distributions of the ages are approximately bell-shaped. compare the z-scores for the actors in the following situation.
best actor
\\(\mu = 45.0\\)
\\(\sigma = 7.5\\)
best supporting actor
\\(\mu = 49.0\\)
\\(\sigma = 15\\)
in a particular year, the best actor was 42 years old and the best supporting actor was 83 years old.
determine the z-scores for each.
best actor: \\(z = -0.40\\)
best supporting actor: \\(z = 2.27\\)
(round to two decimal places as needed.)
interpret the z-scores.
the best actor was dropdown the mean, which dropdown unusual. the best supporting actor was dropdown the mean, which dropdown unusual.
Calculate the z-scores
Using the Z-Score Calculation knowledge point
Interpret the Best Actor z-score
Using the Z-Score Interpretation knowledge point
Interpret the Best Supporting Actor z-score
Using the Z-Score Interpretation knowledge point

Snap & solve any problem in the app
Get step-by-step solutions on Sovi AI
Photo-based solutions with guided steps
Explore more problems and detailed explanations
The Best Actor was <blank>less than 1 standard deviation below</blank> the mean, which <blank>is not</blank> unusual. The Best Supporting Actor was <blank>more than 2 standard deviations above</blank> the mean, which <blank>is</blank> unusual.