QUESTION IMAGE
Question
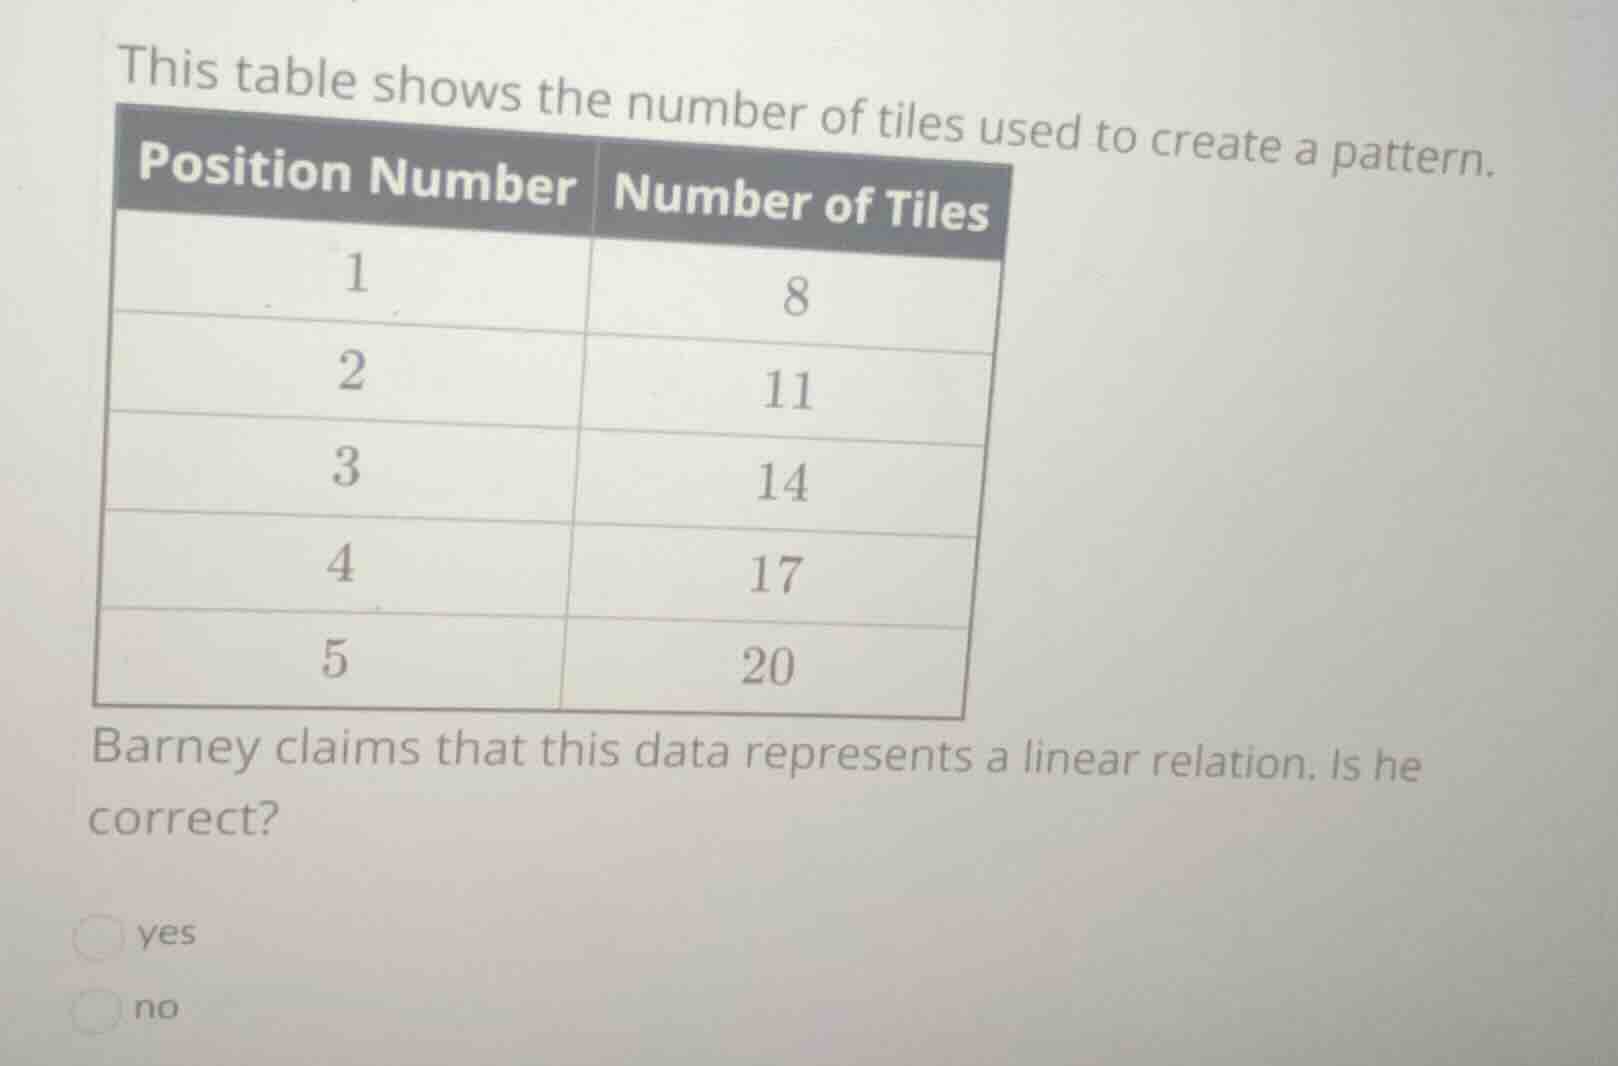
this table shows the number of tiles used to create a pattern.
\
$$\begin{tabular}{|c|c|}
\\hline
\\text{position number} & \\text{number of tiles} \\\\
\\hline
1 & 8 \\\\
\\hline
2 & 11 \\\\
\\hline
3 & 14 \\\\
\\hline
4 & 17 \\\\
\\hline
5 & 20 \\\\
\\hline
\\end{tabular}$$
barney claims that this data represents a linear relation. is he correct?
( ) yes
( ) no
Analyze the given data table
We examine the relationship between the position number \(x\) and the number of tiles \(y\).
The values from the table are:
- For \(x = 1\), \(y = 8\)
- For \(x = 2\), \(y = 11\)
- For \(x = 3\), \(y = 14\)
- For \(x = 4\), \(y = 17\)
- For \(x = 5\), \(y = 20\)
Calculate the first differences
To determine if the relation is linear, we calculate the differences between consecutive \(y\)-values.
- \(11 - 8 = 3\)
- \(14 - 11 = 3\)
- \(17 - 14 = 3\)
- \(20 - 17 = 3\)
Determine if the relation is linear
Since the first differences are constant, the rate of change is constant.
This confirms that the relation is linear.
Therefore, Barney's claim is correct.

Snap & solve any problem in the app
Get step-by-step solutions on Sovi AI
Photo-based solutions with guided steps
Explore more problems and detailed explanations
- yes (Correct answer)
- no