QUESTION IMAGE
Question
select the correct answer from each drop-down menu.
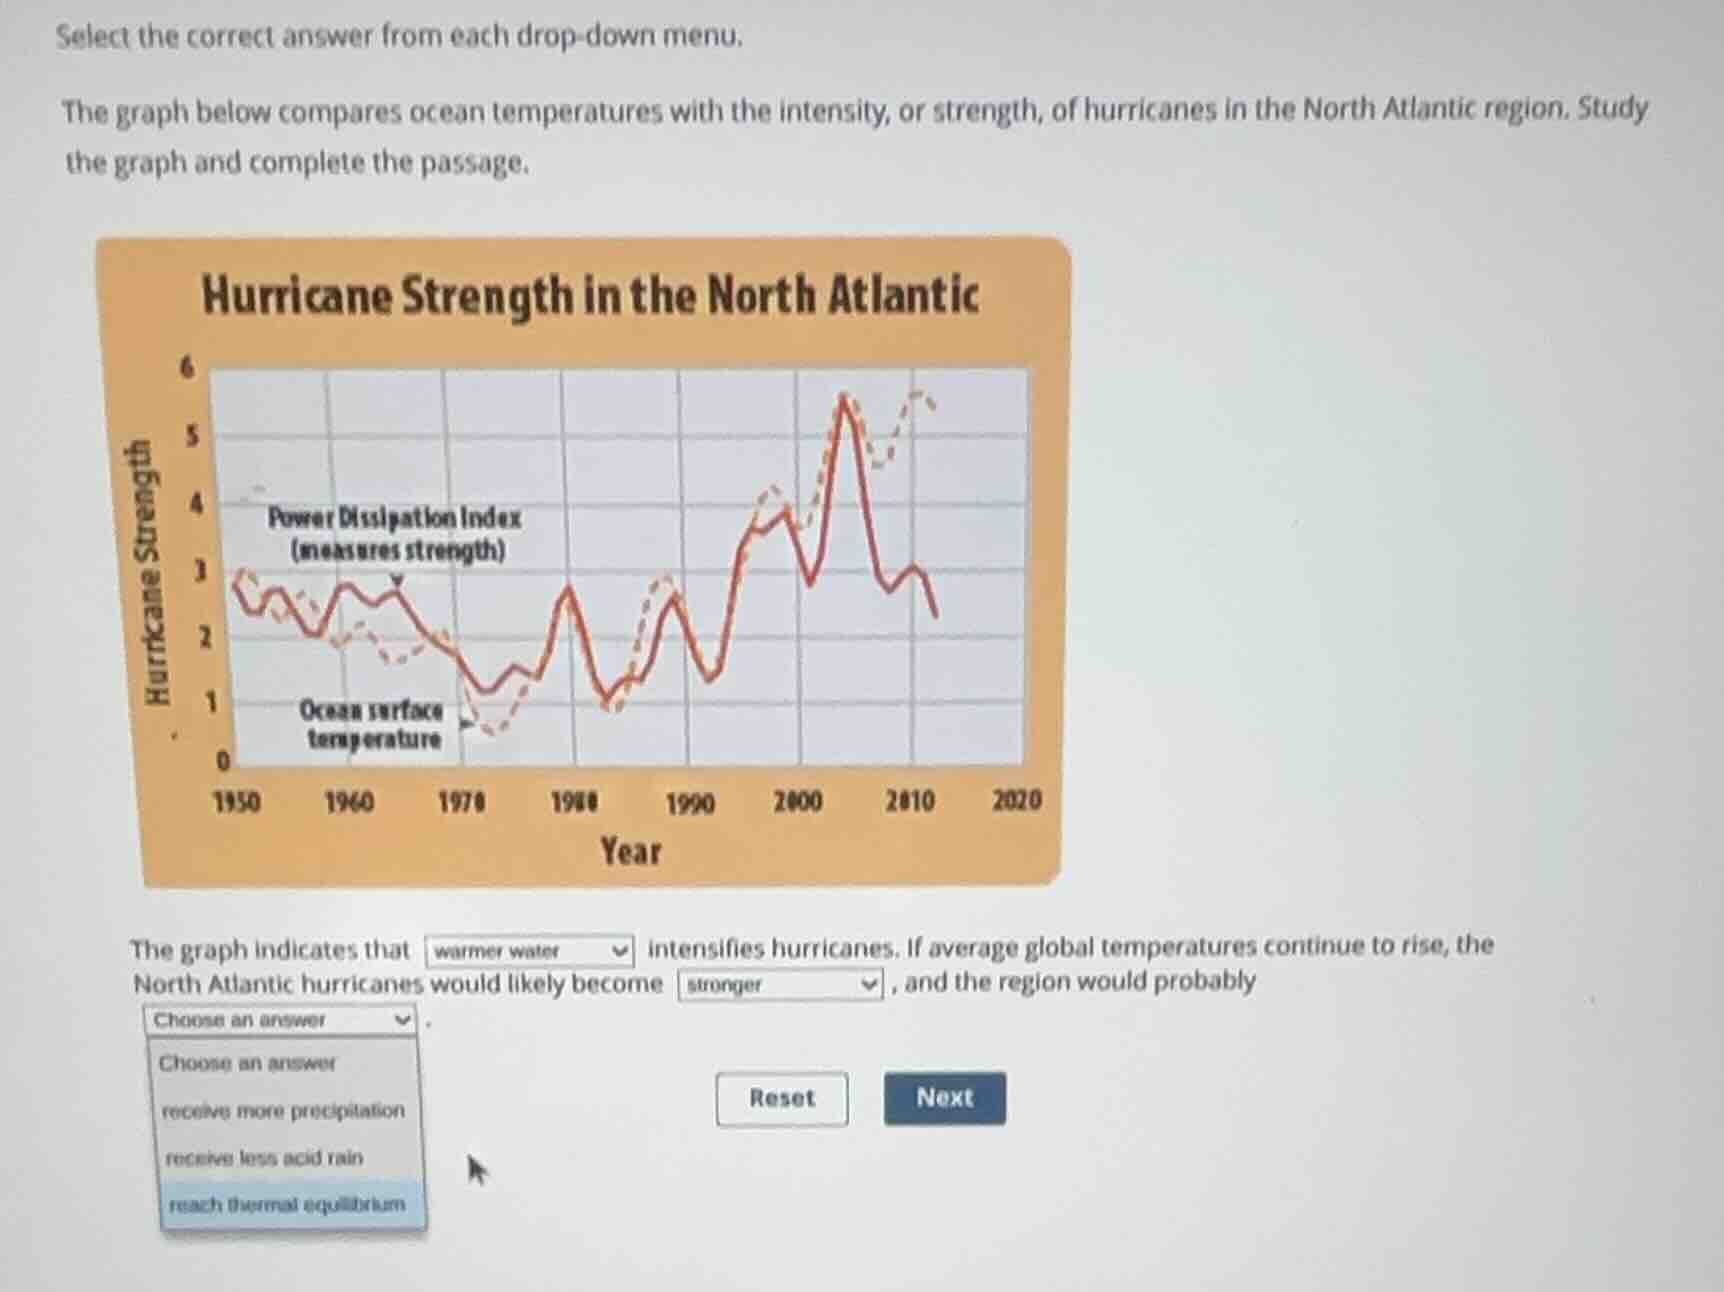
the graph below compares ocean temperatures with the intensity, or strength, of hurricanes in the north atlantic region. study the graph and complete the passage.
the graph indicates that warmer water intensifies hurricanes. if average global temperatures continue to rise, the north atlantic hurricanes would likely become stronger, and the region would probably choose an answer.
choose an answer:
- receive more precipitation
- receive less acid rain
- reach thermal equilibrium
Analizar la correlación del gráfico
Determinar el efecto del aumento de temperatura global
Identificar la consecuencia climática regional

Snap & solve any problem in the app
Get step-by-step solutions on Sovi AI
Photo-based solutions with guided steps
Explore more problems and detailed explanations
The graph indicates that <blank>warmer water</blank> intensifies hurricanes. If average global temperatures continue to rise, the North Atlantic hurricanes would likely become <blank>stronger</blank>, and the region would probably <blank>receive more precipitation</blank>.