QUESTION IMAGE
Question
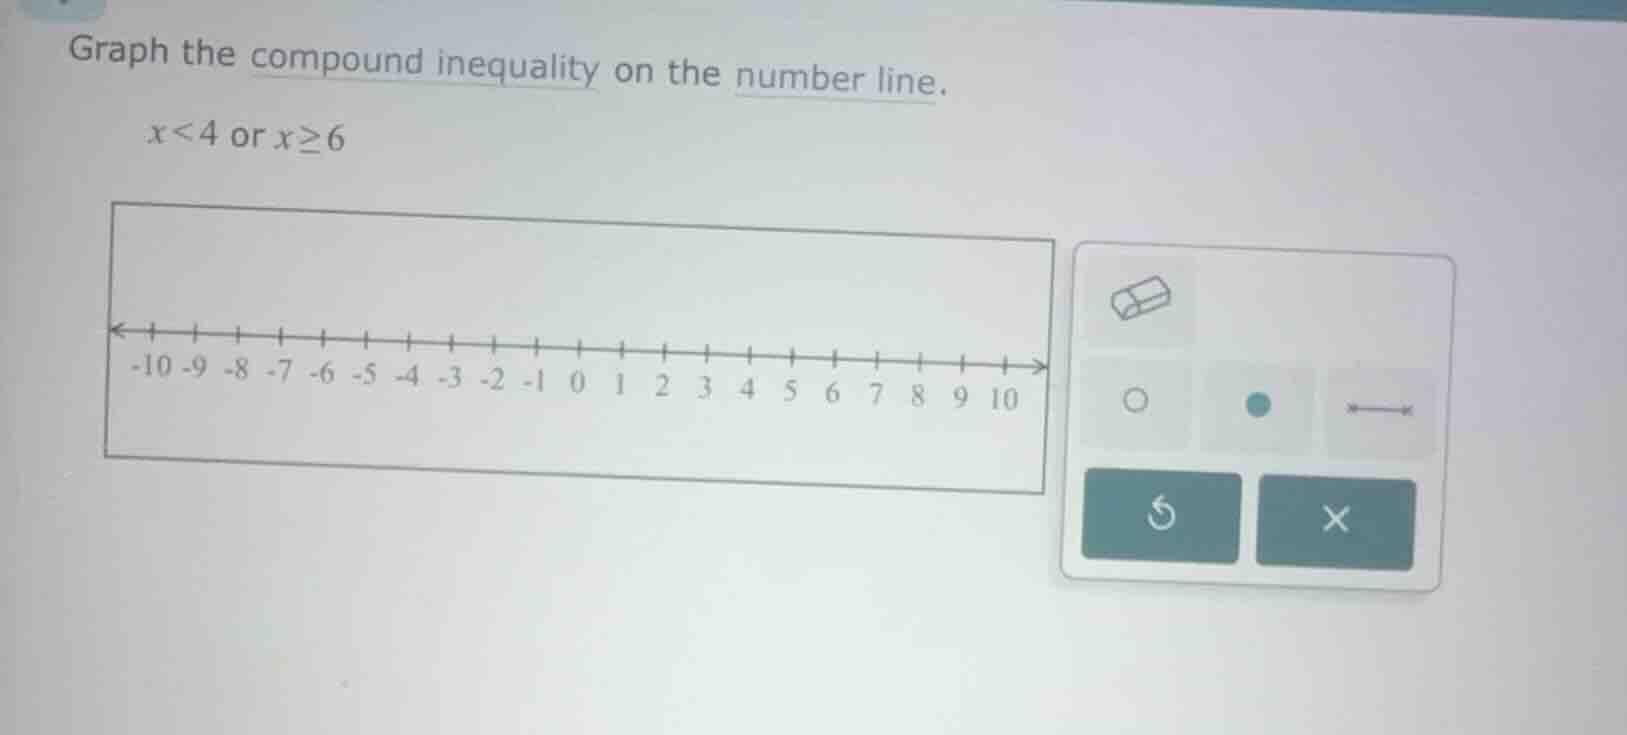
graph the compound inequality on the number line.
(x < 4) or (x ge 6)
<pre_analysis>
{
"quality": "clear",
"question_count": 1,
"skills_matched": [
"step_cot",
"explain_then_answer",
"quick"
],
"needs_drawing": true,
"concepts_used": [
"Compound Inequalities",
"Number Line Graphing"
],
"new_concepts": [],
"current_concepts": [
"Compound Inequalities",
"Number Line Graphing"
]
}
</pre_analysis>
<reasoning>
Analyze the individual inequalities
\[
x < 4 \quad \text{or} \quad x \ge 6
\]
Determine the boundary points and interval types
- For \(x < 4\): An open circle is placed at \(4\), and the arrow points to the left.
- For \(x \ge 6\): A solid (closed) circle is placed at \(6\), and the arrow points to the right.
Combine the graphs on the number line
The compound inequality uses "or", which represents the union of both individual inequality graphs.
</reasoning>
<answer>
To graph the compound inequality \(x < 4\) or \(x \ge 6\) on the number line:
- Place an open circle at \(4\) and draw an arrow pointing to the left (towards negative infinity).
- Place a solid (closed) circle at \(6\) and draw an arrow pointing to the right (towards positive infinity).
</answer>
<plot>
{
"elements": [
{
"type": "line",
"params": [[-10, 0], [10, 0]],
"properties": {
"strokeColor": "#583C87",
"strokeWidth": 2,
"fixed": true
}
},
{
"type": "bentinequality",
"params": [{ "x": 4, "operator": "<" }],
"properties": {
"strokeColor": "#8C55F2",
"strokeWidth": 4
}
},
{
"type": "bentinequality",
"params": [{ "x": 6, "operator": ">=" }],
"properties": {
"strokeColor": "#8C55F2",
"strokeWidth": 4
}
},
{
"type": "point",
"params": [[4, 0]],
"properties": {
"name": "4",
"size": 4,
"fillColor": "white",
"strokeColor": "#8C55F2",
"strokeWidth": 2,
"withLabel": true,
"labelPosition": [0, -15]
}
},
{
"type": "point",
"params": [[6, 0]],
"properties": {
"name": "6",
"size": 4,
"fillColor": "#8C55F2",
"strokeColor": "#8C55F2",
"withLabel": true,
"labelPosition": [0, -15]
}
}
],
"timestamps": [0.5, 1.0]
}
</plot>
<post_analysis>
{
"subject": "Mathematics",
"question_type": "Free Response",
"knowledge_point": [
"Mathematics",
"Algebra",
"Compound Inequalities"
]
}
</post_analysis>

Snap & solve any problem in the app
Get step-by-step solutions on Sovi AI
Photo-based solutions with guided steps
Explore more problems and detailed explanations
<pre_analysis>
{
"quality": "clear",
"question_count": 1,
"skills_matched": [
"step_cot",
"explain_then_answer",
"quick"
],
"needs_drawing": true,
"concepts_used": [
"Compound Inequalities",
"Number Line Graphing"
],
"new_concepts": [],
"current_concepts": [
"Compound Inequalities",
"Number Line Graphing"
]
}
</pre_analysis>
<reasoning>
Analyze the individual inequalities
\[
x < 4 \quad \text{or} \quad x \ge 6
\]
Determine the boundary points and interval types
- For \(x < 4\): An open circle is placed at \(4\), and the arrow points to the left.
- For \(x \ge 6\): A solid (closed) circle is placed at \(6\), and the arrow points to the right.
Combine the graphs on the number line
The compound inequality uses "or", which represents the union of both individual inequality graphs.
</reasoning>
<answer>
To graph the compound inequality \(x < 4\) or \(x \ge 6\) on the number line:
- Place an open circle at \(4\) and draw an arrow pointing to the left (towards negative infinity).
- Place a solid (closed) circle at \(6\) and draw an arrow pointing to the right (towards positive infinity).
</answer>
<plot>
{
"elements": [
{
"type": "line",
"params": [[-10, 0], [10, 0]],
"properties": {
"strokeColor": "#583C87",
"strokeWidth": 2,
"fixed": true
}
},
{
"type": "bentinequality",
"params": [{ "x": 4, "operator": "<" }],
"properties": {
"strokeColor": "#8C55F2",
"strokeWidth": 4
}
},
{
"type": "bentinequality",
"params": [{ "x": 6, "operator": ">=" }],
"properties": {
"strokeColor": "#8C55F2",
"strokeWidth": 4
}
},
{
"type": "point",
"params": [[4, 0]],
"properties": {
"name": "4",
"size": 4,
"fillColor": "white",
"strokeColor": "#8C55F2",
"strokeWidth": 2,
"withLabel": true,
"labelPosition": [0, -15]
}
},
{
"type": "point",
"params": [[6, 0]],
"properties": {
"name": "6",
"size": 4,
"fillColor": "#8C55F2",
"strokeColor": "#8C55F2",
"withLabel": true,
"labelPosition": [0, -15]
}
}
],
"timestamps": [0.5, 1.0]
}
</plot>
<post_analysis>
{
"subject": "Mathematics",
"question_type": "Free Response",
"knowledge_point": [
"Mathematics",
"Algebra",
"Compound Inequalities"
]
}
</post_analysis>