QUESTION IMAGE
Question
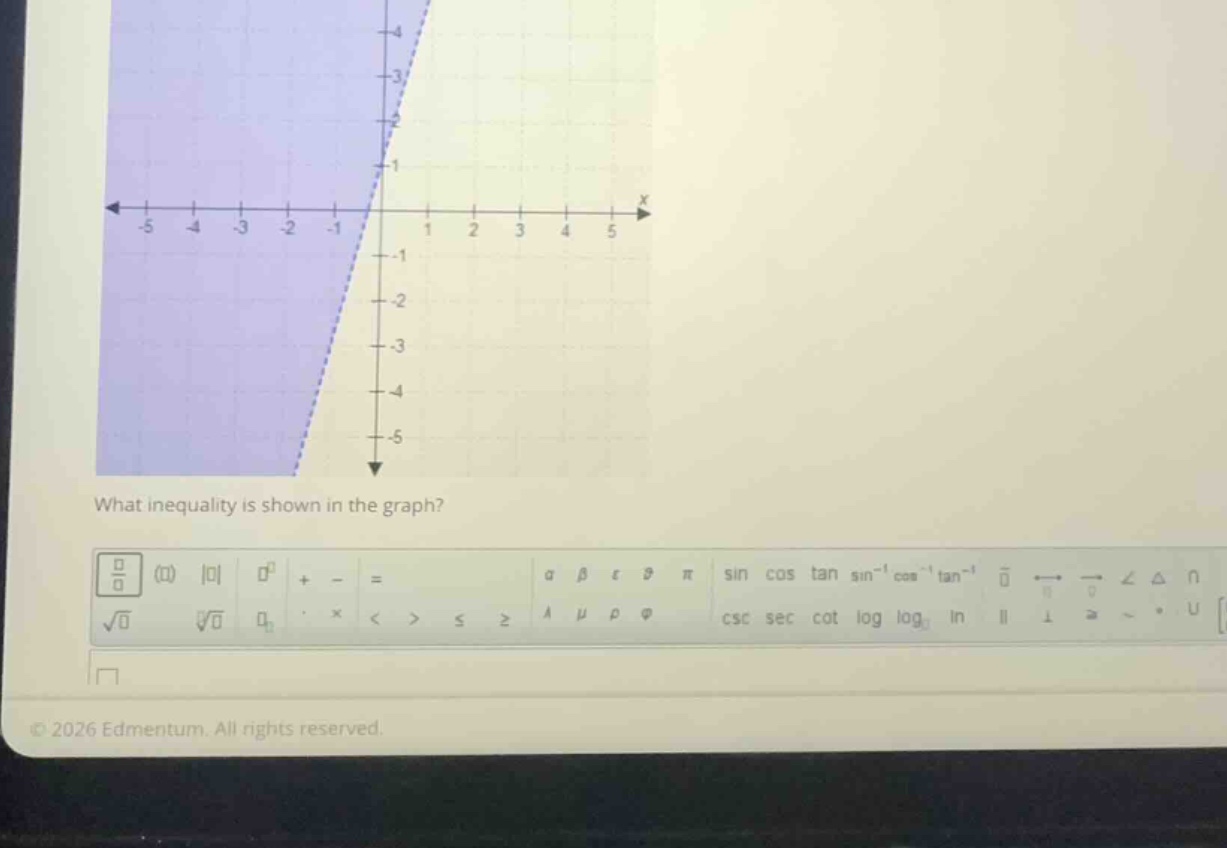
what inequality is shown in the graph?
Find the boundary line equation
The boundary line is dashed, passing through the y-intercept \((0, 1)\) and the x-intercept \((-0.33, 0)\), or more clearly through points \((0, 1)\) and \((-1, -2)\).
$$
\text{Slope } m = \frac{-2 - 1}{-1 - 0} = \frac{-3}{-1} = 3
$$
$$
\text{Equation: } y = 3x + 1
$$
Determine the inequality sign
The boundary line is dashed, so the inequality is strict (\(<\) or \(>\)).
The shaded region is to the left/above the line. Testing the point \((-2, 0)\):
$$
0 > 3(-2) + 1 \implies 0 > -5 \quad (\text{True})
$$
Thus, the inequality is:
$$
y > 3x + 1
$$

Snap & solve any problem in the app
Get step-by-step solutions on Sovi AI
Photo-based solutions with guided steps
Explore more problems and detailed explanations
What inequality is shown in the graph? <blank>\(y > 3x + 1\)</blank>