QUESTION IMAGE
Question
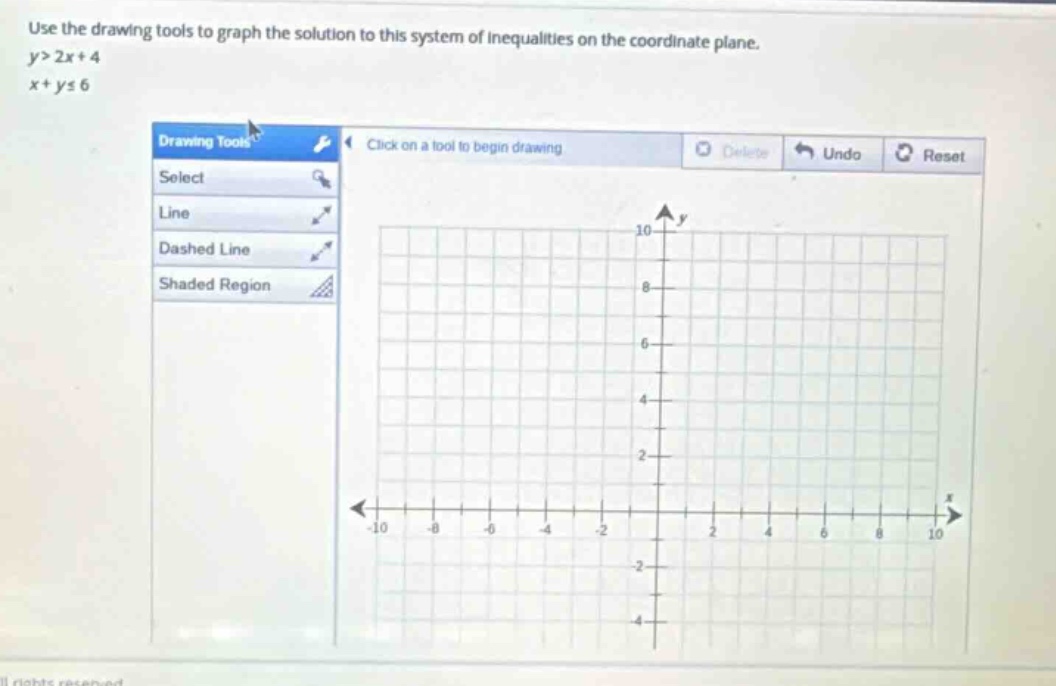
use the drawing tools to graph the solution to this system of inequalities on the coordinate plane.
\\(y > 2x + 4\\)
\\(x + y \le 6\\)
🆕 New Concept Discovered: Graphing Systems of Linear Inequalities
Shading the overlapping region of two boundary lines
Step 1: Graph the first inequality
The first inequality is:
$$ y > 2x + 4 $$
- Boundary Line: The equation of the boundary line is \( y = 2x + 4 \).
- y-intercept: \((0, 4)\)
- Slope (\(m\)): \( 2 \) (move up 2 units and right 1 unit to find another point, such as \((1, 6)\))
- Line Type: Since the inequality symbol is strictly greater than (\(>\)), use a dashed line.
- Shading: Since it is \( y > \), shade the region above the dashed line.
Step 2: Graph the second inequality
The second inequality is:
$$ x + y \le 6 $$
First, rewrite it in slope-intercept form:
$$ y \le -x + 6 $$
- Boundary Line: The equation of the boundary line is \( y = -x + 6 \).
- y-intercept: \((0, 6)\)
- Slope (\(m\)): \( -1 \) (move down 1 unit and right 1 unit to find another point, such as \((1, 5)\) or \((6, 0)\))
- Line Type: Since the inequality symbol is less than or equal to (\(\le\)), use a solid line (labeled "Line" in your tool).
- Shading: Since it is \( y \le \), shade the region below the solid line.
Step 3: Identify the overlapping solution region
The final solution to the system is the region where the shaded areas of both inequalities overlap.
- This region is above the dashed line \( y = 2x + 4 \) and below the solid line \( y = -x + 6 \).
- The two boundary lines intersect where:
$$ 2x + 4 = -x + 6 $$
$$ 3x = 2 \implies x = \frac{2}{3}, \quad y = \frac{16}{3} \approx 5.33 $$
- Use the Shaded Region tool to click inside the section that lies above the dashed line and below the solid line (this will be the region containing points like \((-2, 2)\) or \((0, 5)\)).

Snap & solve any problem in the app
Get step-by-step solutions on Sovi AI
Photo-based solutions with guided steps
Explore more problems and detailed explanations
To graph the solution on your screen:
- First Boundary (Dashed Line):
- Select the Dashed Line tool.
- Plot points at \((0, 4)\) and \((1, 6)\) to draw the dashed line \( y = 2x + 4 \).
- Second Boundary (Solid Line):
- Select the Line tool.
- Plot points at \((0, 6)\) and \((6, 0)\) to draw the solid line \( x + y = 6 \).
- Shading:
- Select the Shaded Region tool.
- Click in the region that is above the dashed line and below the solid line (for example, click near the point \((-2, 3)\)).