QUESTION IMAGE
Question
use all four figures to answer the question below.
what was the profile of most delegates to the constitutional convention?
free white women who were not slaveowners and had non-farming occupations
free white men who were slaveowners and worked as farmers
free white men who were not slaveowners and who were farmers
free white men who were not slaveowners and had non-farming occupations
Analyze the demographic charts for delegates
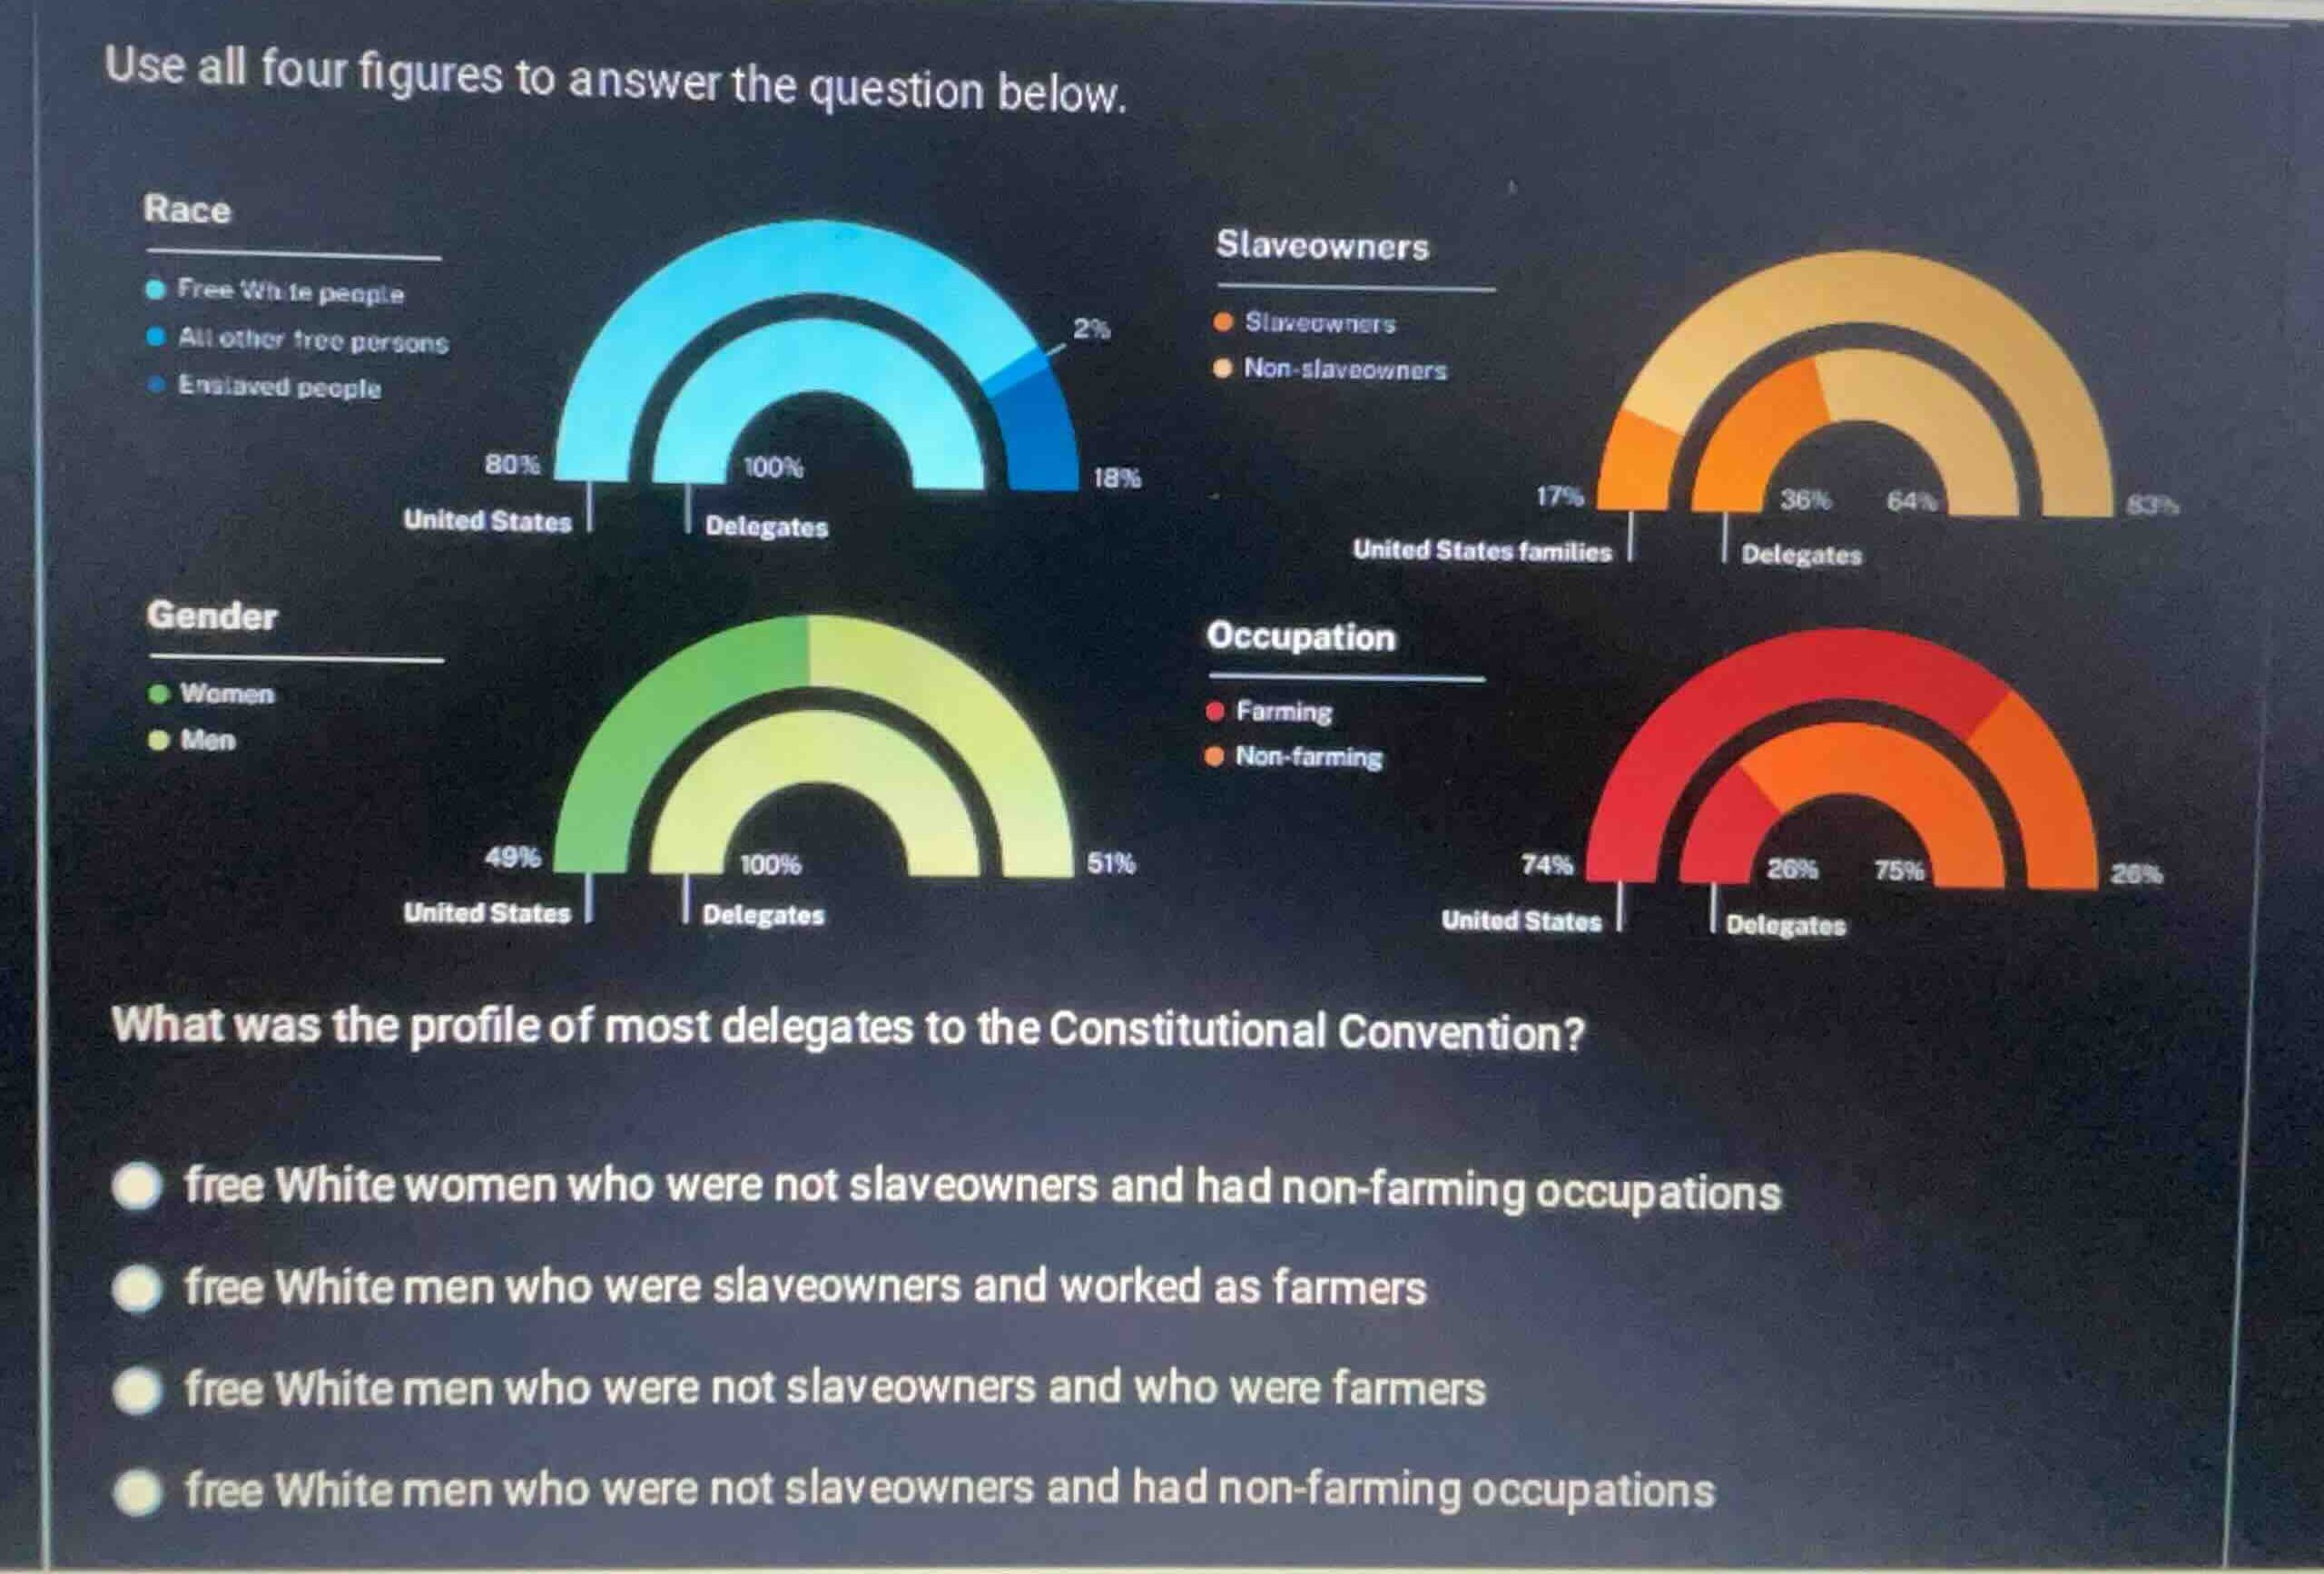
- Race: The inner arc shows that \(100\%\) of the delegates were "Free White people".
- Gender: The inner arc shows that \(100\%\) of the delegates were "Men".
- Slaveowners: The inner arc shows that \(64\%\) of the delegates were "Non-slaveowners" (compared to \(36\%\) who were slaveowners).
- Occupation: The inner arc shows that \(74\%\) of the delegates had "Non-farming" occupations (compared to \(26\%\) in farming).
Synthesize the majority profile
- Combining the majority categories for the delegates: Free White, Men, Non-slaveowners, and Non-farming occupations.
- This matches the profile: "free White men who were not slaveowners and had non-farming occupations".

Snap & solve any problem in the app
Get step-by-step solutions on Sovi AI
Photo-based solutions with guided steps
Explore more problems and detailed explanations
- free White women who were not slaveowners and had non-farming occupations
- free White men who were slaveowners and worked as farmers
- free White men who were not slaveowners and who were farmers
- free White men who were not slaveowners and had non-farming occupations (Correct answer)