QUESTION IMAGE
Question
relations, and understanding polynomials
unit 5: section a activities booklet
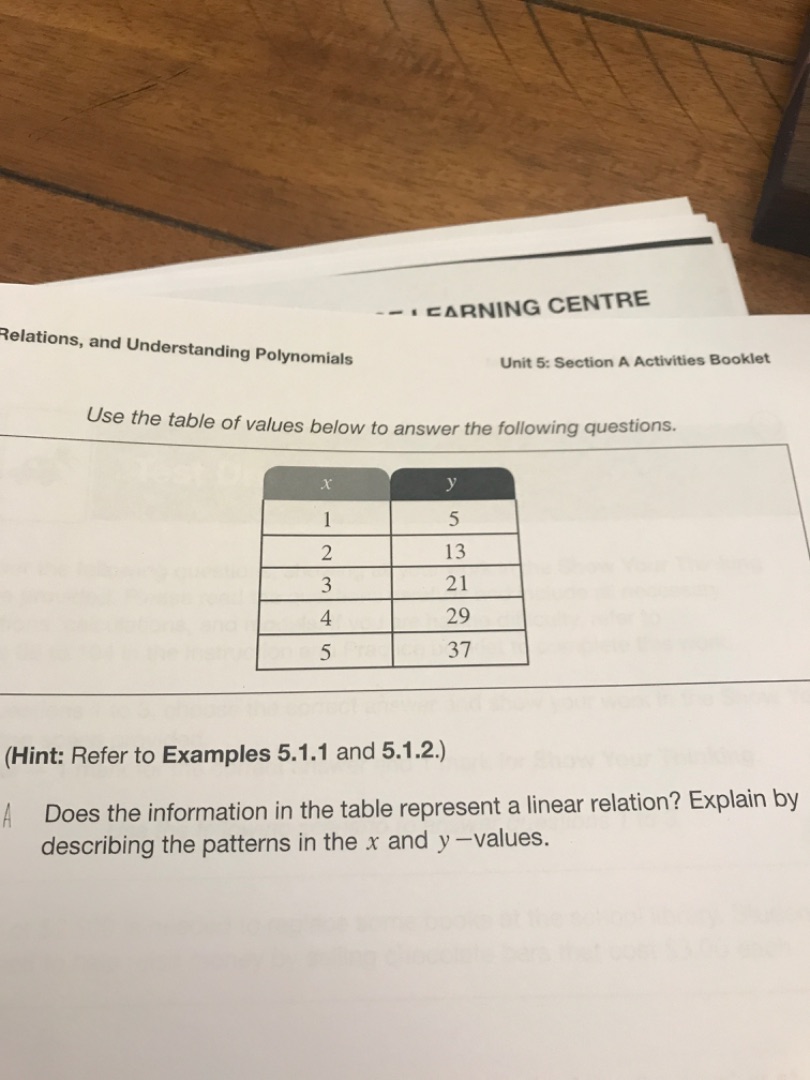
use the table of values below to answer the following questions.
| x | y |
|---|---|
| 2 | 13 |
| 3 | 21 |
| 4 | 29 |
| 5 | 37 |
(hint: refer to examples 5.1.1 and 5.1.2.)
a does the information in the table represent a linear relation? explain by describing the patterns in the x and y-values.
Step1: Analyze x - values pattern
The x - values are \(1, 2, 3, 4, 5\). The difference between consecutive x - values is \(2 - 1=1\), \(3 - 2 = 1\), \(4 - 3=1\), \(5 - 4 = 1\). So the x - values increase by a constant difference of 1.
Step2: Analyze y - values pattern
The y - values are \(5, 13, 21, 29, 37\). Calculate the difference between consecutive y - values: \(13 - 5=8\), \(21 - 13 = 8\), \(29 - 21=8\), \(37 - 29 = 8\). The y - values increase by a constant difference of 8.
Step3: Determine linear relation
For a relation to be linear, the rate of change (slope) should be constant. The rate of change between two points \((x_1,y_1)\) and \((x_2,y_2)\) is given by \(\frac{y_2 - y_1}{x_2 - x_1}\). Since the change in x (\(\Delta x\)) is always 1 and the change in y (\(\Delta y\)) is always 8, the slope \(\frac{\Delta y}{\Delta x}=\frac{8}{1} = 8\) (constant). So, when the x - values have a constant difference and the y - values also have a constant difference, the relation is linear.

Snap & solve any problem in the app
Get step-by-step solutions on Sovi AI
Photo-based solutions with guided steps
Explore more problems and detailed explanations
Yes, the information in the table represents a linear relation. The x - values increase by 1 (constant difference) and the y - values increase by 8 (constant difference), indicating a constant rate of change (slope), which is a characteristic of a linear relation.