QUESTION IMAGE
Question
rational exponents
assignment active
analyze the data using regression
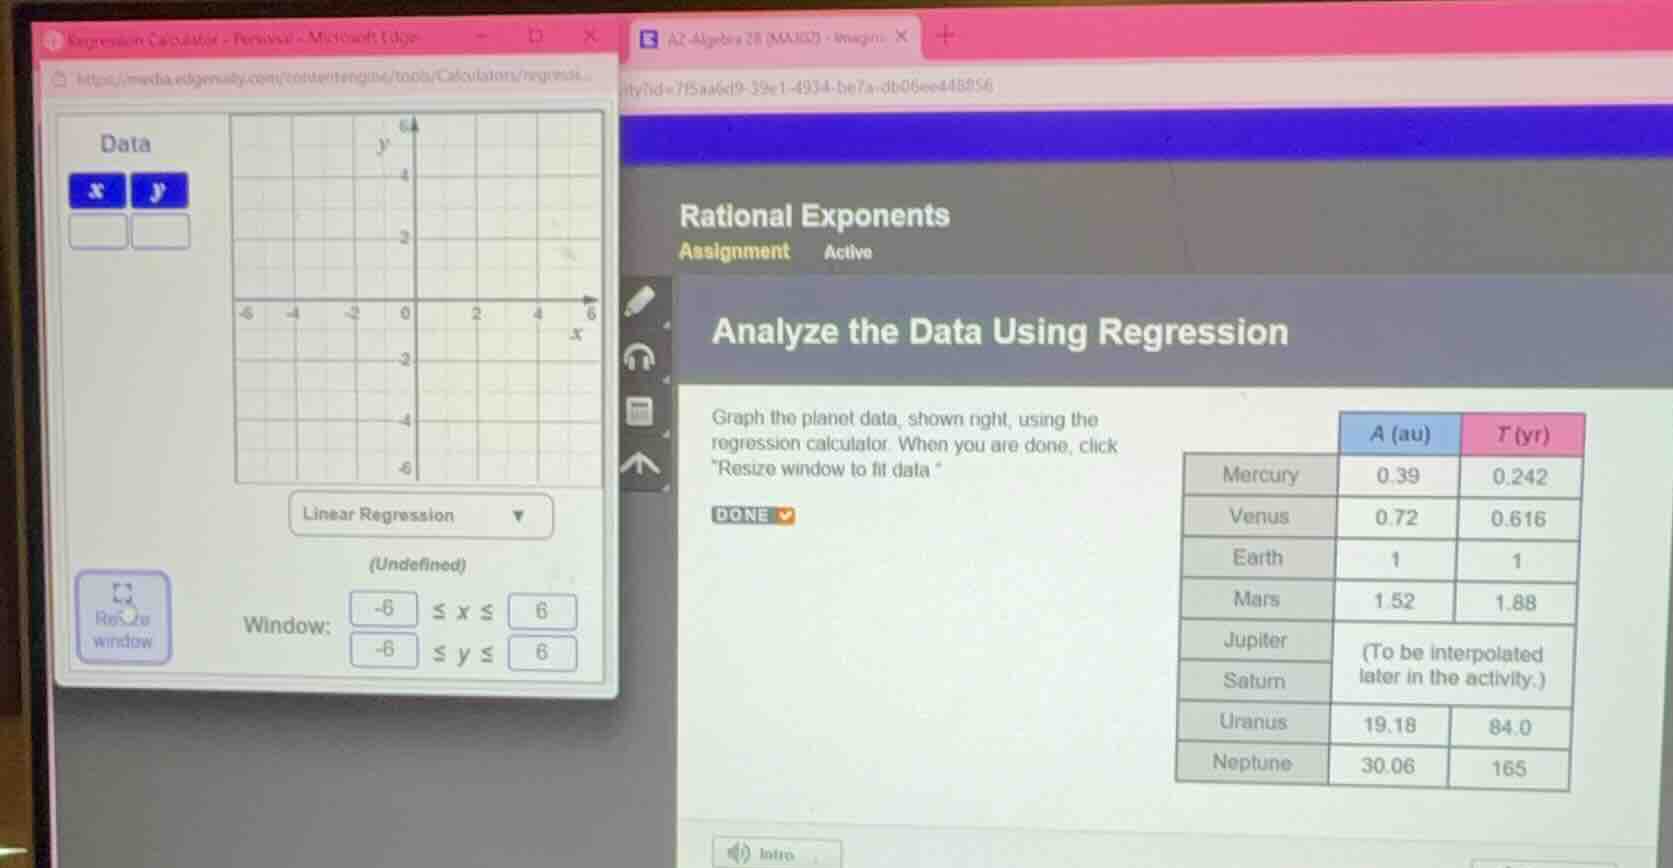
graph the planet data, shown right, using the regression calculator. when you are done, click
esize window to fit data.\
| a (au) | t (yr) | |
|---|---|---|
| venus | 0.72 | 0.616 |
| earth | 1 | 1 |
| mars | 1.52 | 1.88 |
| jupiter | (to be interpolated later in the activity.) | |
| saturn | ||
| uranus | 19.18 | 84.0 |
| neptune | 30.06 | 165 |
Identify the mathematical relationship in the data
Using the Rational Exponents and Radical to Exponential Form knowledge points
Formulate the regression model
The relationship between the semi-major axis \(A\) (in astronomical units, au) and the orbital period \(T\) (in years, yr) is modeled by Kepler's Third Law:
This is a power regression model of the form \(T = a \cdot A^b\), where \(a \approx 1\) and \(b \approx 1.5\).

Snap & solve any problem in the app
Get step-by-step solutions on Sovi AI
Photo-based solutions with guided steps
Explore more problems and detailed explanations
The data is modeled by the power regression equation:
or in radical form:
where:
- \(A\) is the semi-major axis in astronomical units (au).
- \(T\) is the orbital period in years (yr).