QUESTION IMAGE
Question
question 11
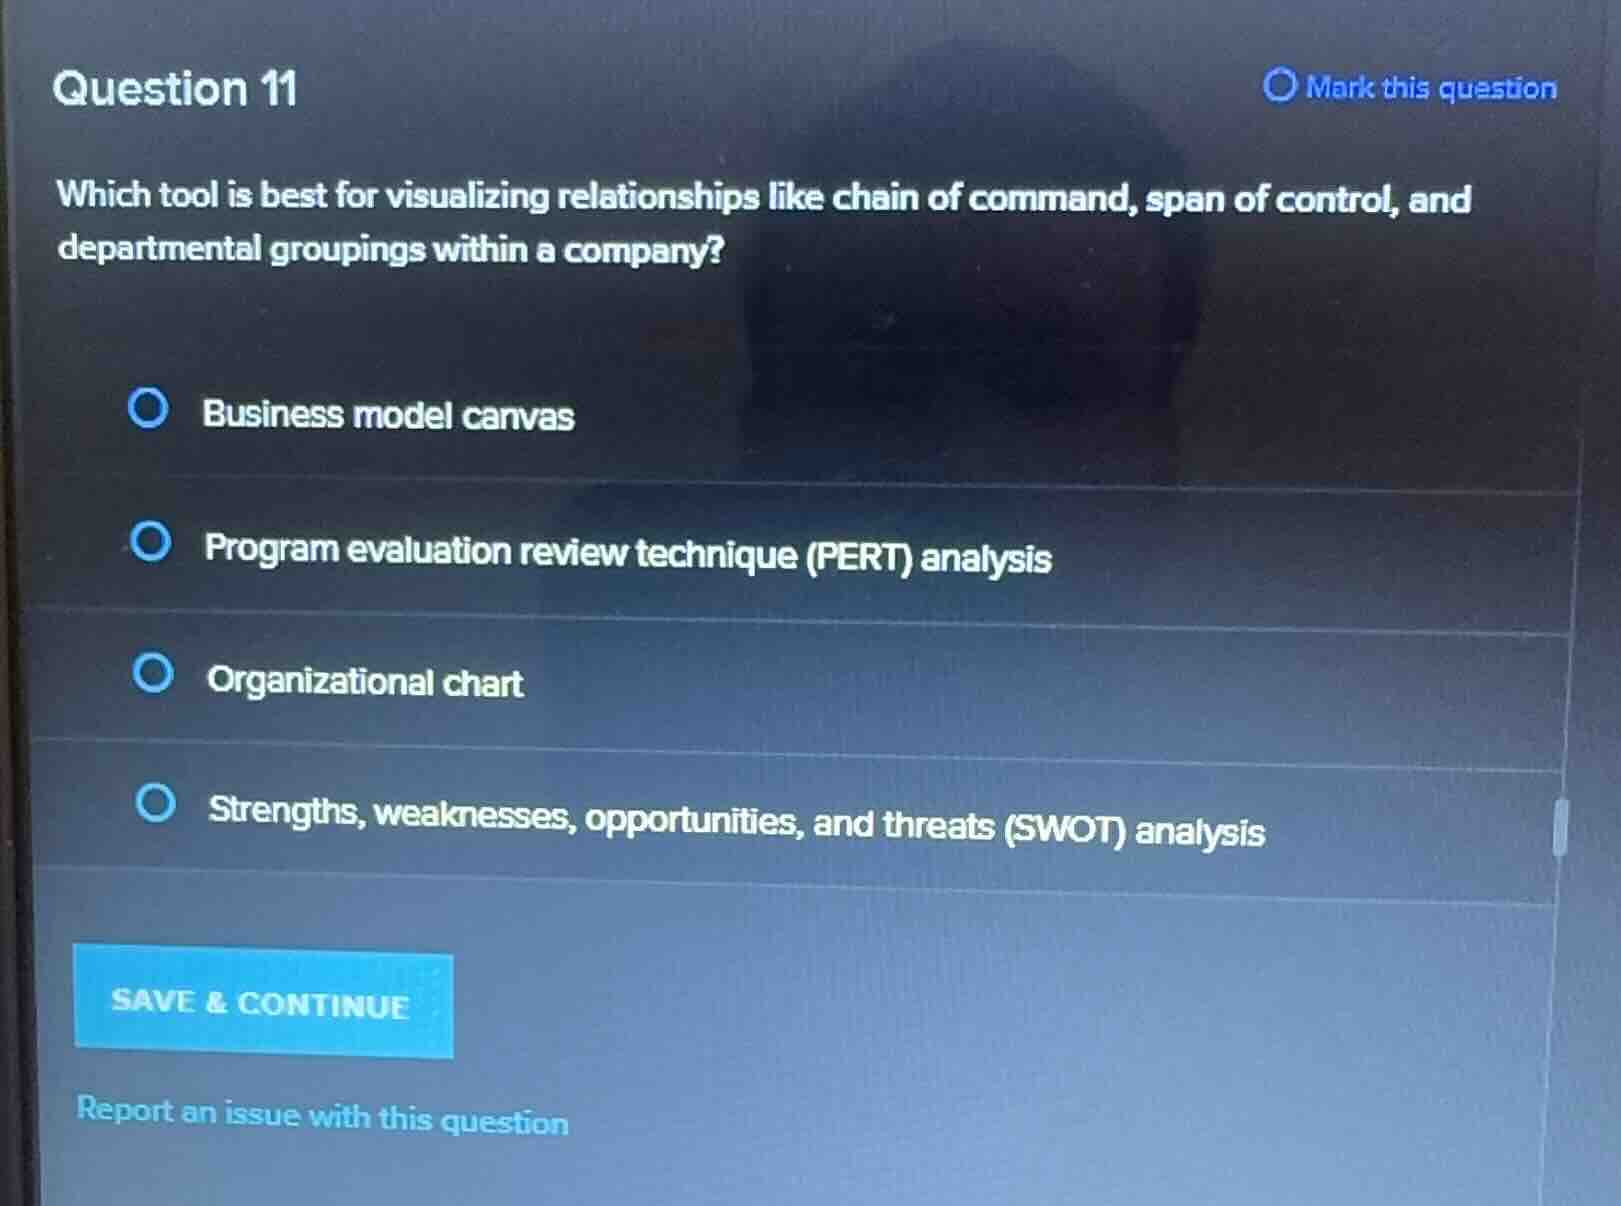
which tool is best for visualizing relationships like chain of command, span of control, and departmental groupings within a company?
business model canvas
program evaluation review technique (pert) analysis
organizational chart
strengths, weaknesses, opportunities, and threats (swot) analysis
Identify the core concepts in the question
Using the Chain of Command and Organizational Structure knowledge points
- The question asks for a tool to visualize relationships such as chain of command, span of control, and departmental groupings.
- These elements represent the formal reporting relationships and hierarchy within a company.
Evaluate the given options
- Business model canvas: A strategic management template used for developing new or documenting existing business models (value proposition, infrastructure, customers, finances).
- Program evaluation review technique (PERT) analysis: A project management tool used to analyze and represent the tasks involved in completing a given project, especially the time needed to complete each task.
- Organizational chart: A diagram that visually outlines the internal structure of a company, detailing roles, responsibilities, relationships, departmental groupings, span of control, and the chain of command.
- SWOT analysis: A strategic planning tool used to identify Strengths, Weaknesses, Opportunities, and Threats related to business competition or project planning.
Select the best matching tool
- The Organizational chart is specifically designed to visually map out reporting hierarchies, departmental divisions, and spans of control.

Snap & solve any problem in the app
Get step-by-step solutions on Sovi AI
Photo-based solutions with guided steps
Explore more problems and detailed explanations
- (A) Business model canvas
- (B) Program evaluation review technique (PERT) analysis
- (C) Organizational chart (Correct answer)
- (D) Strengths, weaknesses, opportunities, and threats (SWOT) analysis