QUESTION IMAGE
Question
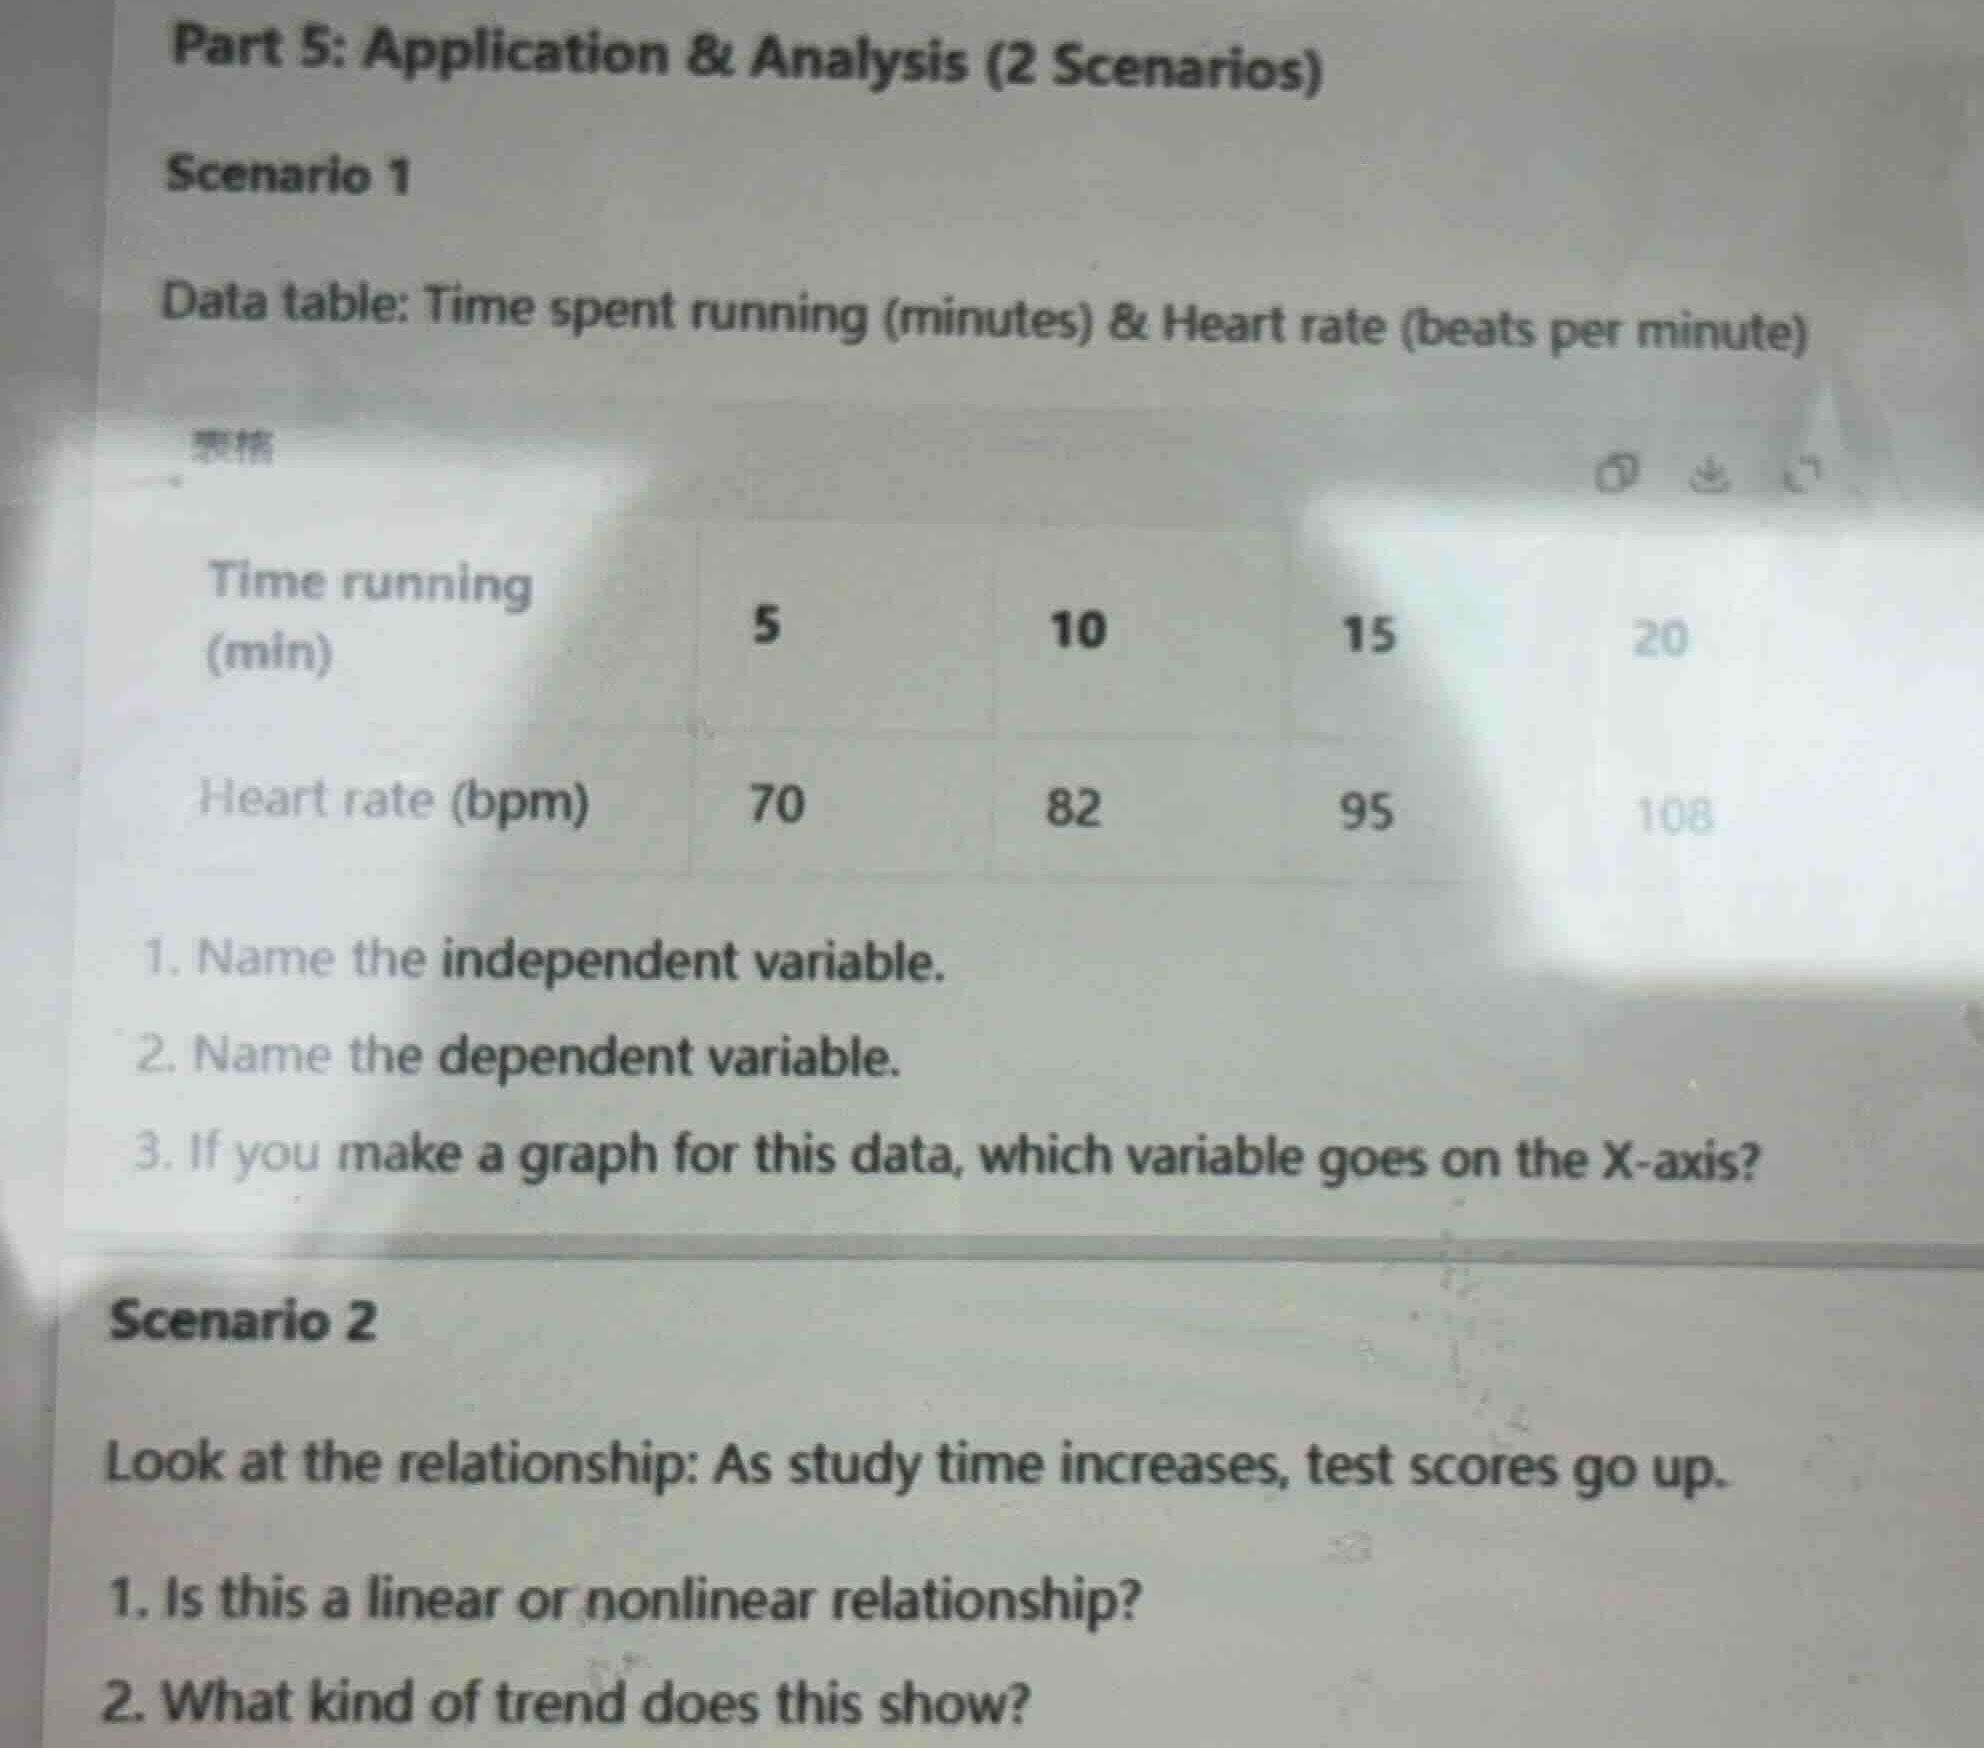
part 5: application & analysis (2 scenarios)
scenario 1
data table: time spent running (minutes) & heart rate (beats per minute)
time running (min) | 5 | 10 | 15 | 20
heart rate (bpm) | 70 | 82 | 95 | 108
- name the independent variable.
- name the dependent variable.
- if you make a graph for this data, which variable goes on the x-axis?
scenario 2
look at the relationship: as study time increases, test scores go up.
- is this a linear or nonlinear relationship?
- what kind of trend does this show?
Identify variables in Scenario 1
Using the Scientific Variables and Data Tables knowledge points.
The independent variable is controlled or chosen (Time running).
The dependent variable changes in response (Heart rate).
Determine the graphing axis
Using the Graphing Data knowledge point.
The independent variable always goes on the horizontal X-axis.
Therefore, Time running goes on the X-axis.
Analyze Scenario 2 relationship type
Using the Linear and Nonlinear Relationships knowledge point.
A constant direction of change suggests a linear relationship.
As study time increases, test scores go up steadily.
Identify the trend in Scenario 2
Using the Linear and Nonlinear Relationships knowledge point.
Both variables increase together, showing a positive trend.
This is also called a positive correlation.

Snap & solve any problem in the app
Get step-by-step solutions on Sovi AI
Photo-based solutions with guided steps
Explore more problems and detailed explanations
Scenario 1
- Independent variable: Time running (min)
- Dependent variable: Heart rate (bpm)
- Variable on the X-axis: Time running (min)
Scenario 2
- Relationship type: Linear relationship
- Trend: Positive trend (or positive correlation)