QUESTION IMAGE
Question
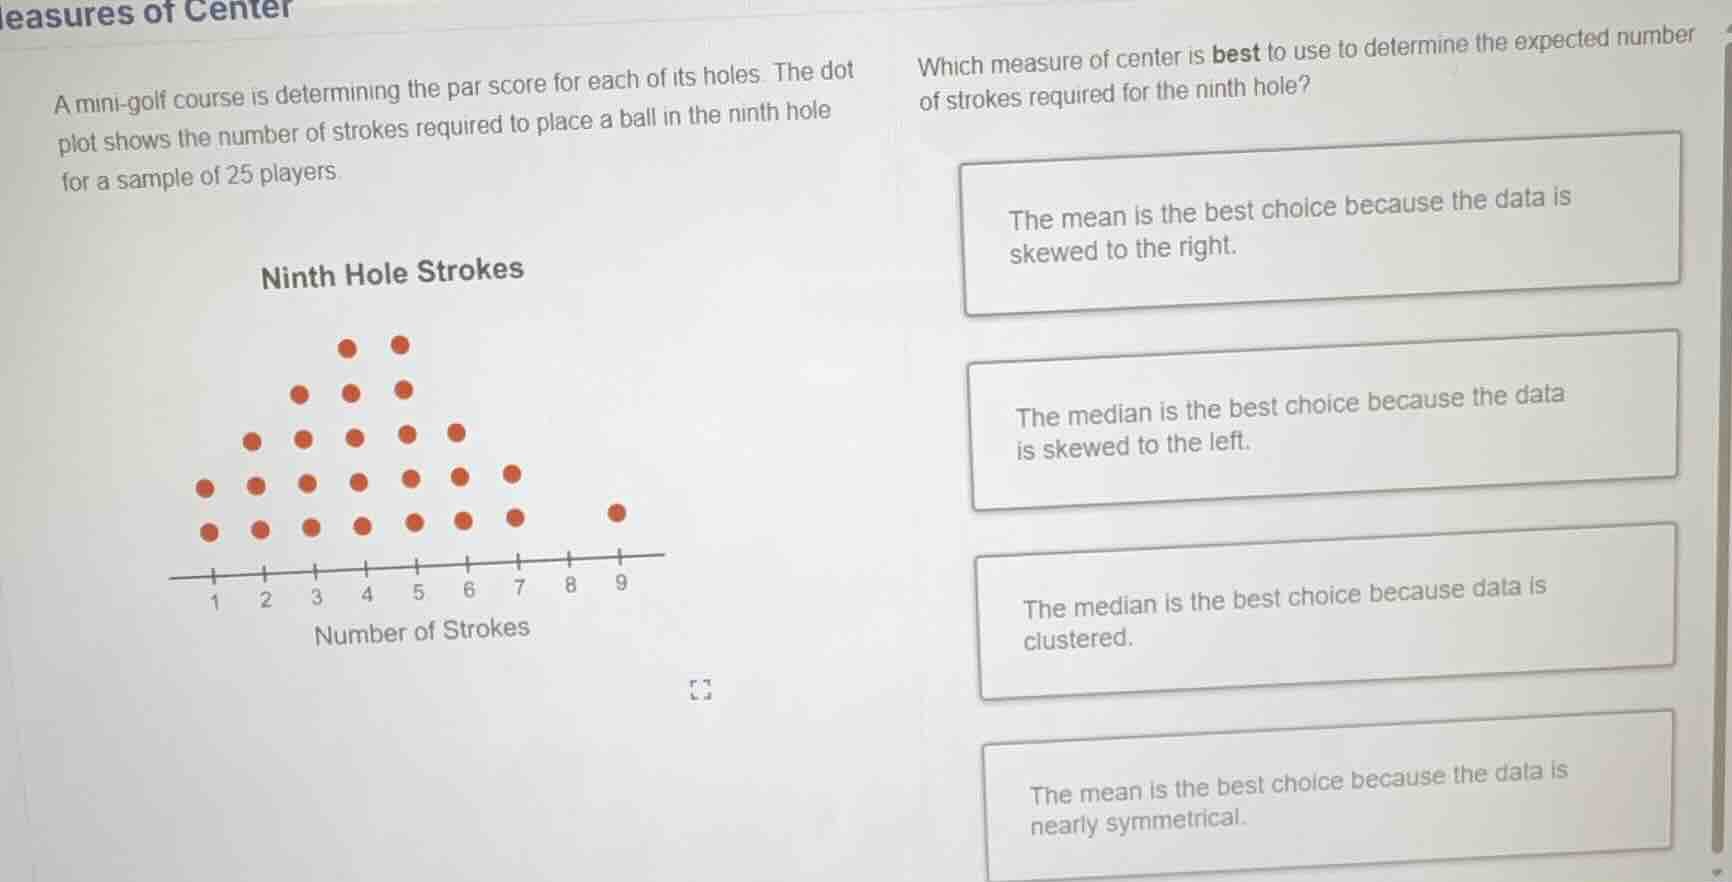
a mini-golf course is determining the par score for each of its holes. the dot plot shows the number of strokes required to place a ball in the ninth hole for a sample of 25 players.
which measure of center is best to use to determine the expected number of strokes required for the ninth hole?
- the mean is the best choice because the data is skewed to the right.
- the median is the best choice because the data is skewed to the left.
- the median is the best choice because the data is clustered.
- the mean is the best choice because the data is nearly symmetrical.
<pre_analysis>
{
"quality": "clear",
"question_count": 1,
"skills_matched": [
"direct_cot",
"multiple_choice_formatter",
"explain_then_answer",
"quick"
],
"needs_drawing": false,
"concepts_used": [
"Measures of Center"
],
"new_concepts": [],
"current_concepts": [
"Measures of Center",
"Graphical Interpretation"
]
}
</pre_analysis>
<reasoning>
Analyze the shape of the data distribution
The dot plot displays the number of strokes for 25 players. Looking at the distribution of the dots:
- 1 stroke: 2 dots
- 2 strokes: 3 dots
- 3 strokes: 4 dots
- 4 strokes: 5 dots
- 5 strokes: 5 dots
- 6 strokes: 3 dots
- 7 strokes: 2 dots
- 8 strokes: 0 dots
- 9 strokes: 1 dot
The majority of the data is concentrated between 2 and 6 strokes, peaking at 4 and 5. The distribution is nearly symmetrical around the center (4 and 5), with a single minor outlier at 9. Because the distribution is nearly symmetrical and has no extreme skewness that would heavily distort the average, the mean is the most appropriate measure of center to represent the expected value.
Evaluate the given options
- Option 1: "The mean is the best choice because the data is skewed to the right." (Incorrect, the data is not heavily skewed).
- Option 2: "The median is the best choice because the data is skewed to the left." (Incorrect, the data is not skewed to the left).
- Option 3: "The median is the best choice because data is clustered." (Incorrect, clustering alone does not make the median better than the mean; symmetry favors the mean).
- Option 4: "The mean is the best choice because the data is nearly symmetrical." (Correct, nearly symmetrical distributions are best represented by the mean).
</reasoning>
<answer>
<mcq-option>The mean is the best choice because the data is skewed to the right.</mcq-option>
<mcq-option>The median is the best choice because the data is skewed to the left.</mcq-option>
<mcq-option>The median is the best choice because data is clustered.</mcq-option>
<mcq-correct>The mean is the best choice because the data is nearly symmetrical.</mcq-correct>
</answer>
<post_analysis>
{
"subject": "Mathematics",
"question_type": "Multiple Choice",
"knowledge_point": [
"Mathematics",
"Statistics",
"Measures of Center"
]
}
</post_analysis>

Snap & solve any problem in the app
Get step-by-step solutions on Sovi AI
Photo-based solutions with guided steps
Explore more problems and detailed explanations
<pre_analysis>
{
"quality": "clear",
"question_count": 1,
"skills_matched": [
"direct_cot",
"multiple_choice_formatter",
"explain_then_answer",
"quick"
],
"needs_drawing": false,
"concepts_used": [
"Measures of Center"
],
"new_concepts": [],
"current_concepts": [
"Measures of Center",
"Graphical Interpretation"
]
}
</pre_analysis>
<reasoning>
Analyze the shape of the data distribution
The dot plot displays the number of strokes for 25 players. Looking at the distribution of the dots:
- 1 stroke: 2 dots
- 2 strokes: 3 dots
- 3 strokes: 4 dots
- 4 strokes: 5 dots
- 5 strokes: 5 dots
- 6 strokes: 3 dots
- 7 strokes: 2 dots
- 8 strokes: 0 dots
- 9 strokes: 1 dot
The majority of the data is concentrated between 2 and 6 strokes, peaking at 4 and 5. The distribution is nearly symmetrical around the center (4 and 5), with a single minor outlier at 9. Because the distribution is nearly symmetrical and has no extreme skewness that would heavily distort the average, the mean is the most appropriate measure of center to represent the expected value.
Evaluate the given options
- Option 1: "The mean is the best choice because the data is skewed to the right." (Incorrect, the data is not heavily skewed).
- Option 2: "The median is the best choice because the data is skewed to the left." (Incorrect, the data is not skewed to the left).
- Option 3: "The median is the best choice because data is clustered." (Incorrect, clustering alone does not make the median better than the mean; symmetry favors the mean).
- Option 4: "The mean is the best choice because the data is nearly symmetrical." (Correct, nearly symmetrical distributions are best represented by the mean).
</reasoning>
<answer>
<mcq-option>The mean is the best choice because the data is skewed to the right.</mcq-option>
<mcq-option>The median is the best choice because the data is skewed to the left.</mcq-option>
<mcq-option>The median is the best choice because data is clustered.</mcq-option>
<mcq-correct>The mean is the best choice because the data is nearly symmetrical.</mcq-correct>
</answer>
<post_analysis>
{
"subject": "Mathematics",
"question_type": "Multiple Choice",
"knowledge_point": [
"Mathematics",
"Statistics",
"Measures of Center"
]
}
</post_analysis>