QUESTION IMAGE
Question
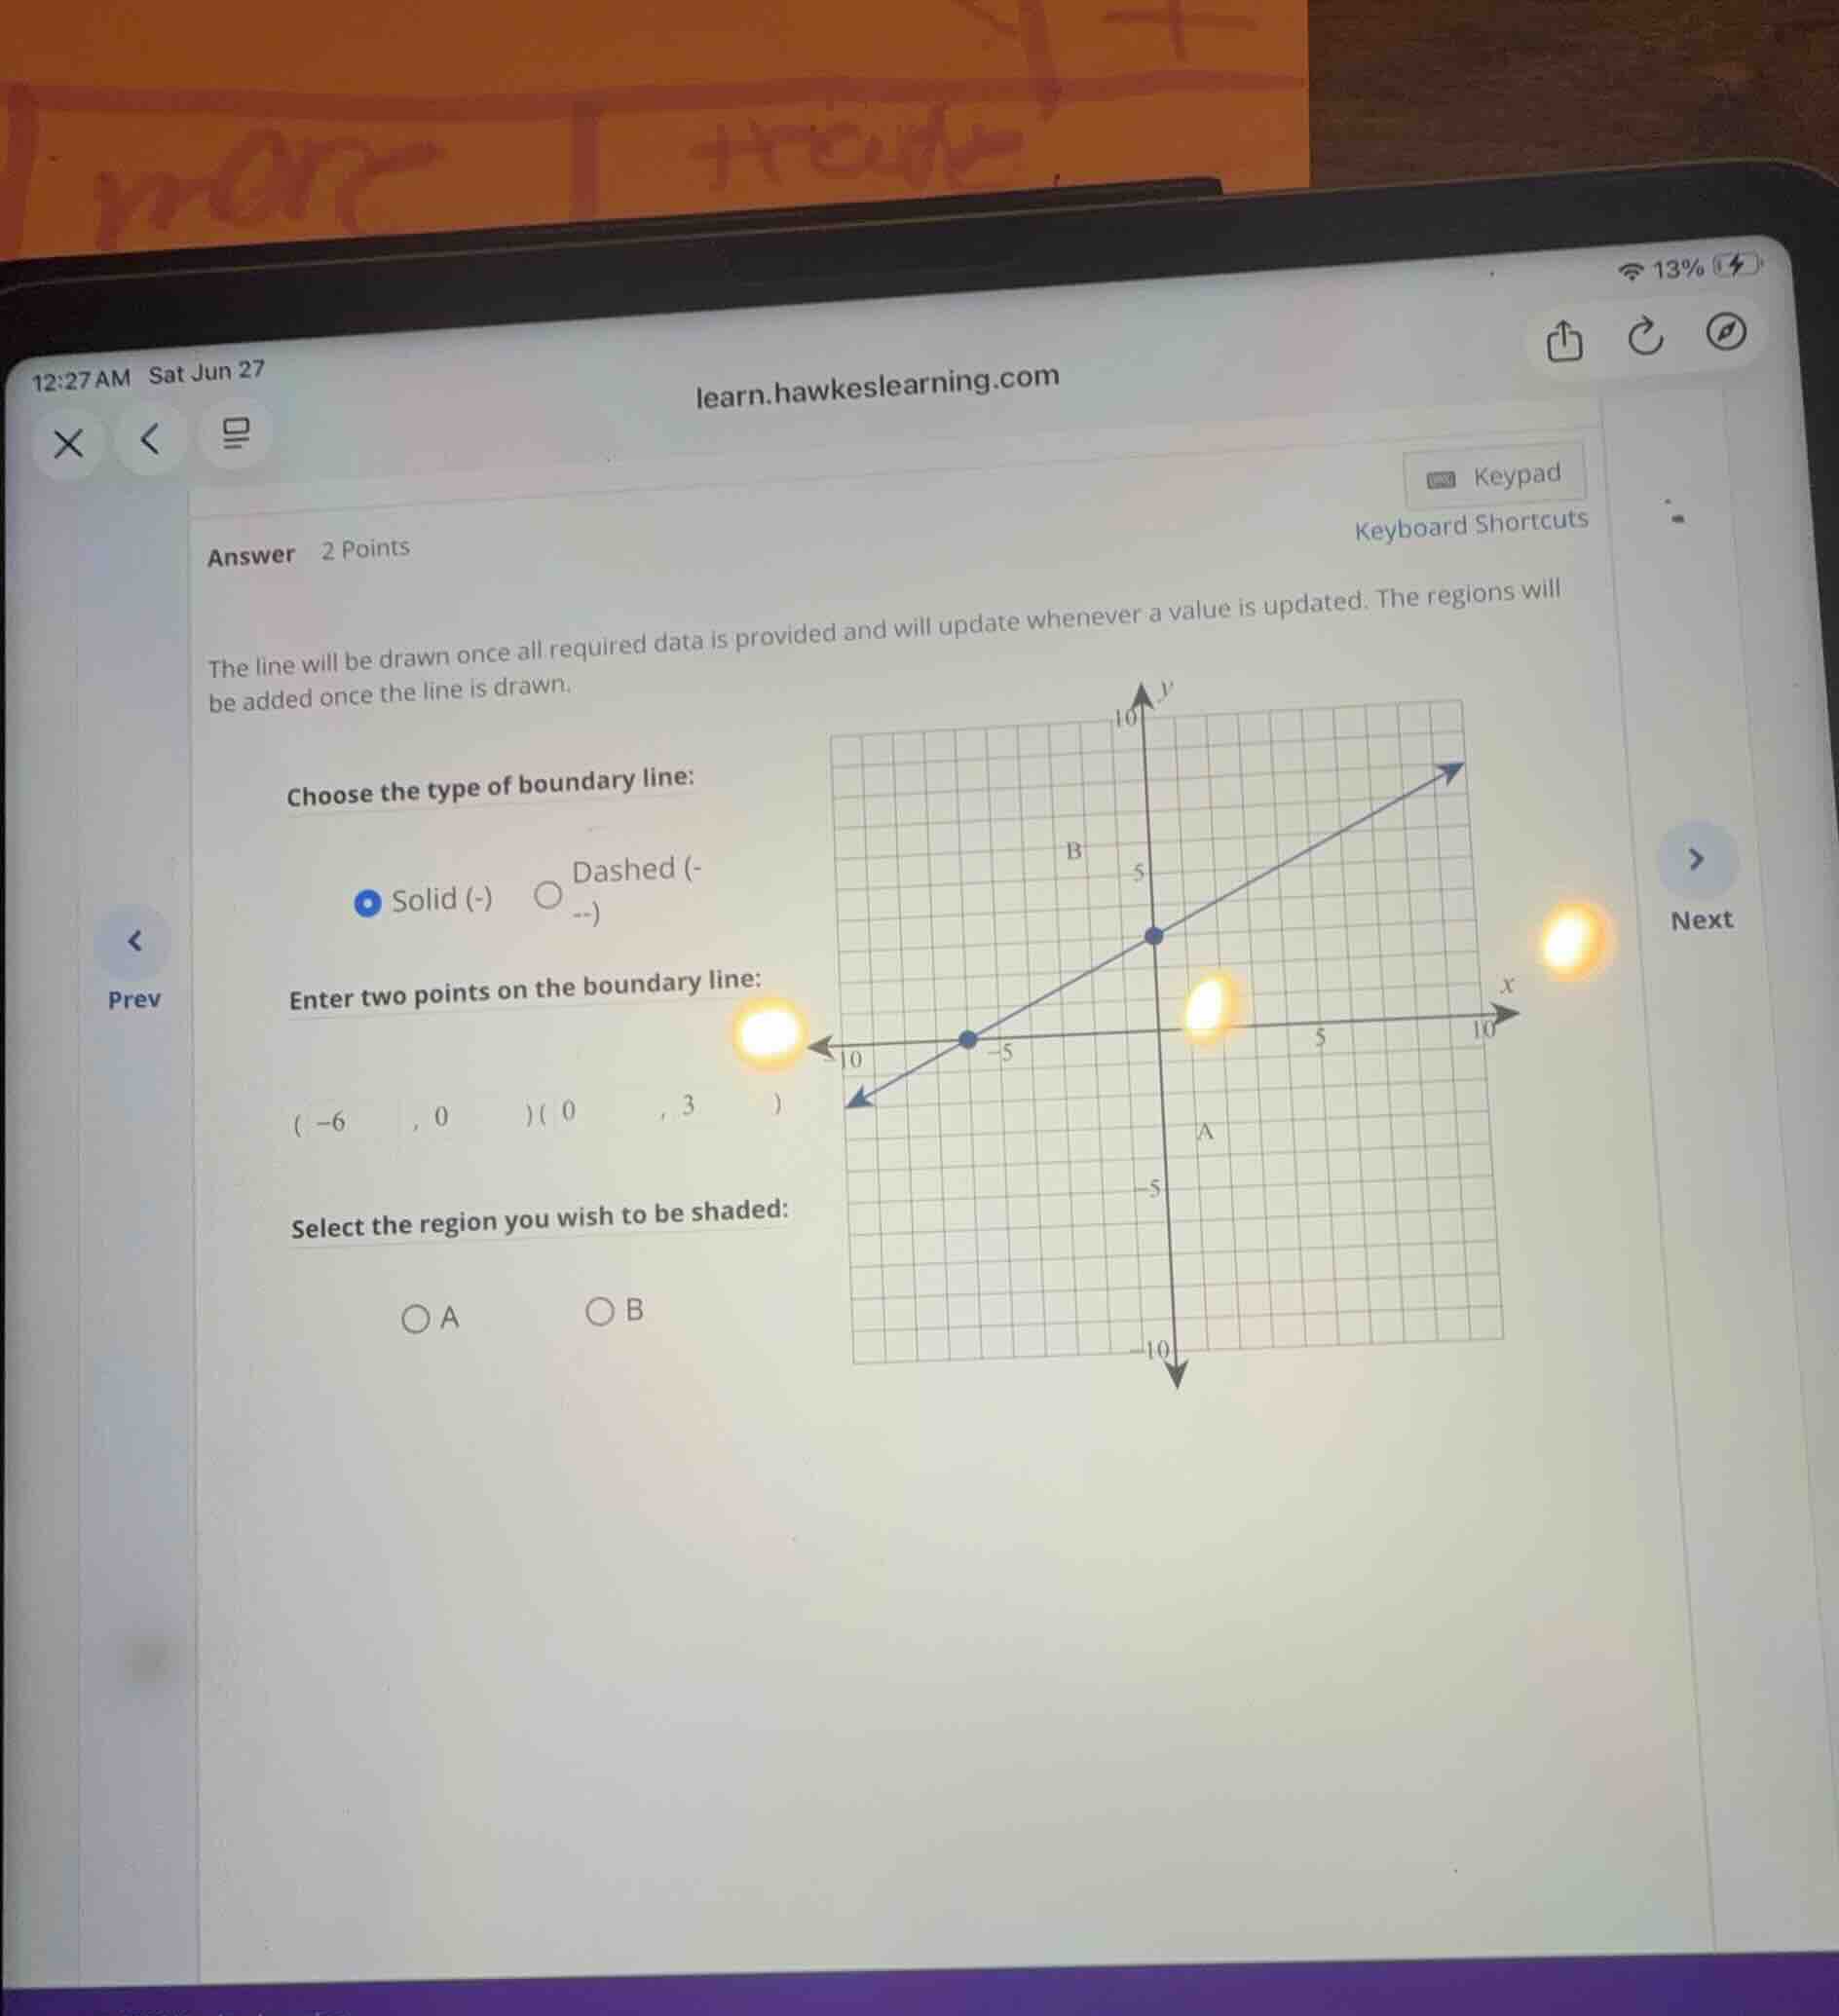
the line will be drawn once all required data is provided and will update whenever a value is updated. the regions will be added once the line is drawn.
choose the type of boundary line:
solid (-)
dashed (--)
enter two points on the boundary line:
\\((-6, 0)\\) \\((0, 3)\\)
select the region you wish to be shaded:
a
b
Identify the boundary line type
Using the Graphing Linear Inequalities in Two Variables knowledge point
The boundary line shown on the grid is solid.
Solid (-)
Identify the two points on the boundary line
Using the Plotting Points and Intercepts of a Line knowledge points
Determine the equation of the boundary line
Using the Intercepts of a Line knowledge point
Determine the shaded region
Using the Graphing Linear Inequalities in Two Variables knowledge point
The image shows a line dividing the coordinate plane into two regions: region A (below the line) and region B (above the line). Since the final shaded region is not yet selected, we can describe the options:
- Region A represents the half-plane below the line \(y \le \frac{1}{2}x + 3\).
- Region B represents the half-plane above the line \(y \ge \frac{1}{2}x + 3\).

Snap & solve any problem in the app
Get step-by-step solutions on Sovi AI
Photo-based solutions with guided steps
Explore more problems and detailed explanations
- Type of boundary line: Solid (-)
- Two points on the boundary line: \((-6, 0)\) and \((0, 3)\)
- Region to be shaded: Select A if the inequality is of the form \(y \le \frac{1}{2}x + 3\) (shading below the line), or select B if the inequality is of the form \(y \ge \frac{1}{2}x + 3\) (shading above the line).