QUESTION IMAGE
Question
introduction to linear functions
pre-test
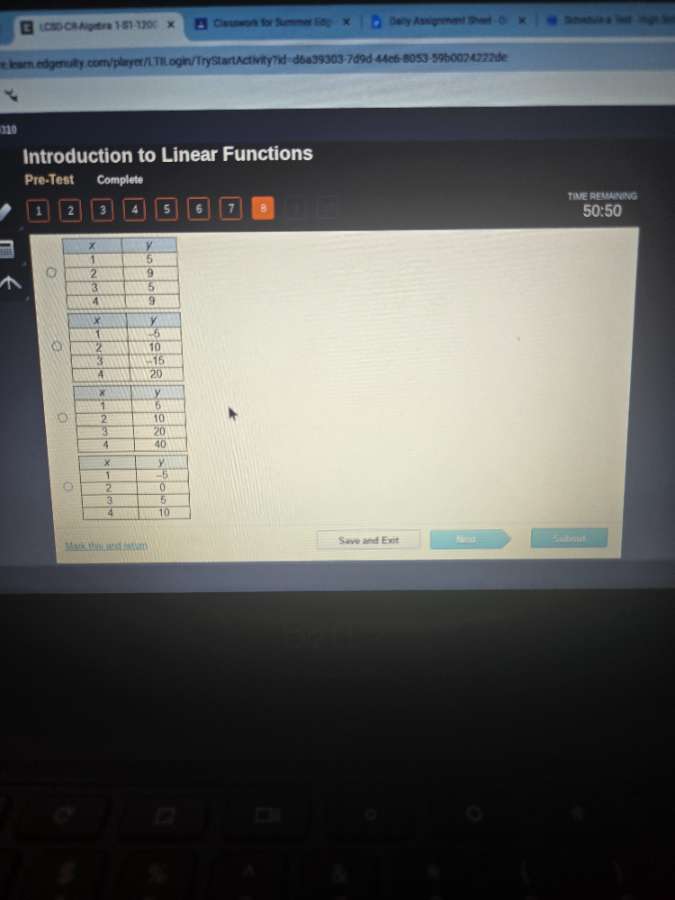
option 1:
\
$$\begin{array}{|c|c|}
\\hline
x & y \\\\
\\hline
1 & 5 \\\\
\\hline
2 & 9 \\\\
\\hline
3 & 5 \\\\
\\hline
4 & 9 \\\\
\\hline
\\end{array}$$
option 2:
\
$$\begin{array}{|c|c|}
\\hline
x & y \\\\
\\hline
1 & -5 \\\\
\\hline
2 & 10 \\\\
\\hline
3 & -15 \\\\
\\hline
4 & 20 \\\\
\\hline
\\end{array}$$
option 3:
\
$$\begin{array}{|c|c|}
\\hline
x & y \\\\
\\hline
1 & 5 \\\\
\\hline
2 & 10 \\\\
\\hline
3 & 20 \\\\
\\hline
4 & 40 \\\\
\\hline
\\end{array}$$
option 4:
\
$$\begin{array}{|c|c|}
\\hline
x & y \\\\
\\hline
1 & -5 \\\\
\\hline
2 & 0 \\\\
\\hline
3 & 5 \\\\
\\hline
4 & 10 \\\\
\\hline
\\end{array}$$
⚡ Using what you learned: understanding linear functions
Step 1: Identify the definition of a linear function
A table represents a linear function if the rate of change (slope) between consecutive points is constant. This means as \( x \) increases by a constant amount, \( y \) must also change by a constant amount.
In all four tables, \( x \) increases by \( 1 \) at each step:
$$ \Delta x = 1 $$
We need to find the table where the change in \( y \) (\( \Delta y \)) is constant.
Step 2: Analyze the tables
- Table 1:
- From \( y = 5 \) to \( 9 \): \( \Delta y = +4 \)
- From \( y = 9 \) to \( 5 \): \( \Delta y = -4 \)
- Not constant.
- Table 2:
- From \( y = -5 \) to \( 10 \): \( \Delta y = +15 \)
- From \( y = 10 \) to \( -15 \): \( \Delta y = -25 \)
- Not constant.
- Table 3:
- From \( y = 5 \) to \( 10 \): \( \Delta y = +5 \)
- From \( y = 10 \) to \( 20 \): \( \Delta y = +10 \)
- Not constant.
- Table 4:
- From \( y = -5 \) to \( 0 \): \( \Delta y = +5 \)
- From \( y = 0 \) to \( 5 \): \( \Delta y = +5 \)
- From \( y = 5 \) to \( 10 \): \( \Delta y = +5 \)
- Constant rate of change: \( m = 5 \).

Snap & solve any problem in the app
Get step-by-step solutions on Sovi AI
Photo-based solutions with guided steps
Explore more problems and detailed explanations
The fourth table represents a linear function:
| \( x \) | \( y \) |
|---|---|
| 2 | 0 |
| 3 | 5 |
| 4 | 10 |