QUESTION IMAGE
Question
Question was provided via image upload.
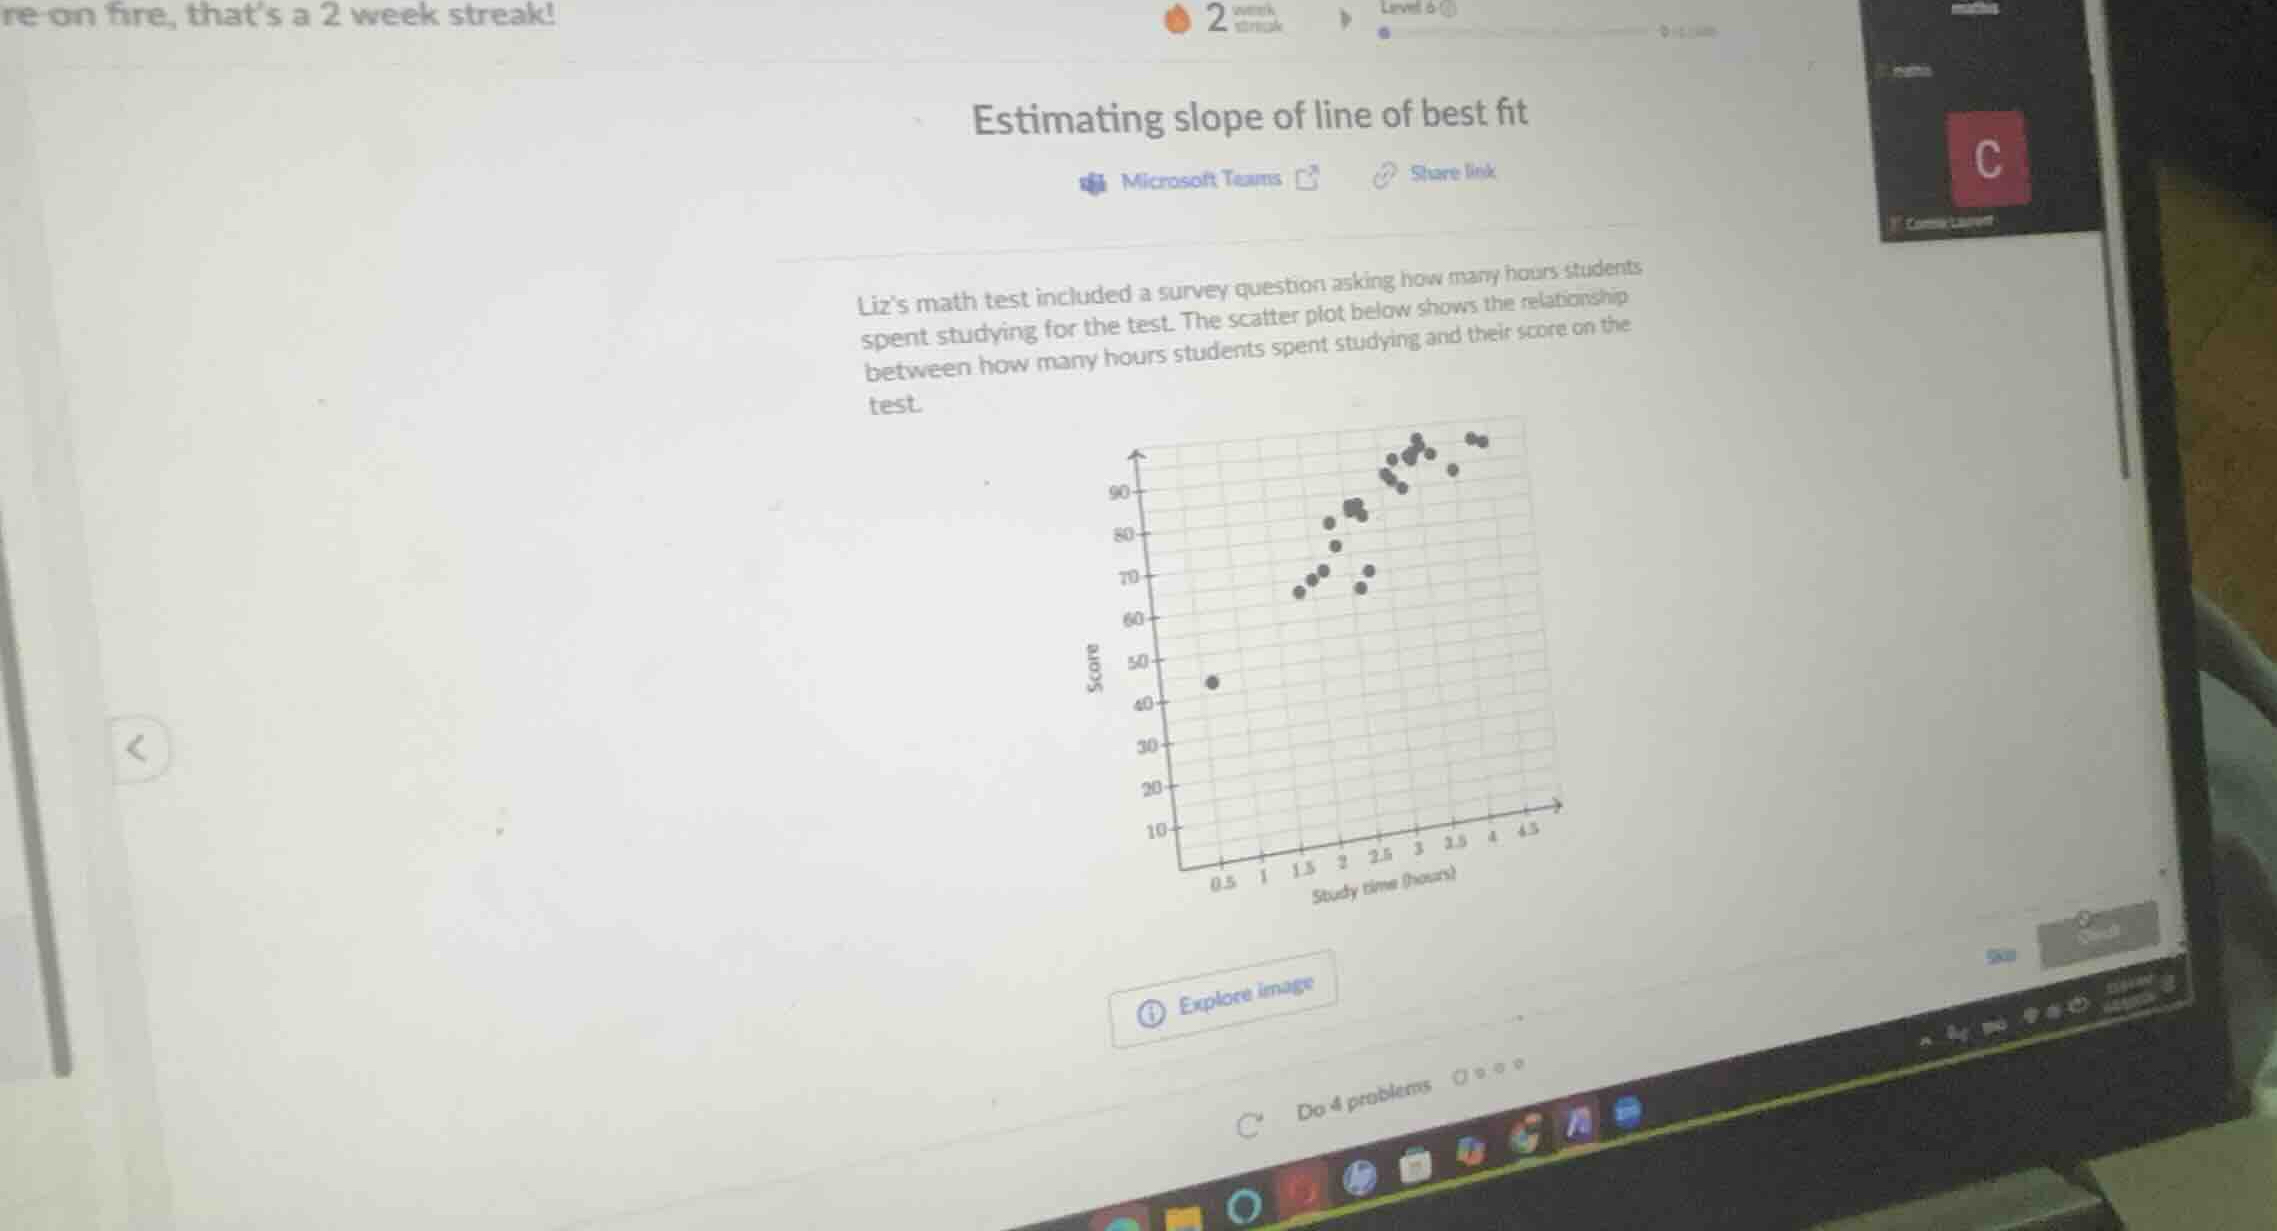
Identify key data points
We locate representative points along the trend of the scatter plot.
At \(1.5\) hours of study time, the scores are clustered around \(65\) to \(70\).
At \(3.5\) hours of study time, the scores are clustered around \(95\) to \(100\).
Select two representative points
We choose two points to estimate the line of best fit:
Point 1: \((1.5, 68)\)
Point 2: \((3.5, 96)\)
Calculate the estimated slope
We apply the slope formula:
Substituting our chosen points:
Verify with alternative points
Using another pair of points along the trend:
Point A: \((1.0, 60)\) (extrapolated trend line start)
Point B: \((3.0, 90)\)
The estimated slope is approximately \(14\) to \(15\) score points per hour of study.

Snap & solve any problem in the app
Get step-by-step solutions on Sovi AI
Photo-based solutions with guided steps
Explore more problems and detailed explanations
The estimated slope of the line of best fit is approximately \(14\) (or in the range of \(13\) to \(15\)) score points per hour of studying.