QUESTION IMAGE
Question
Question was provided via image upload.
Identify the missing coordinates
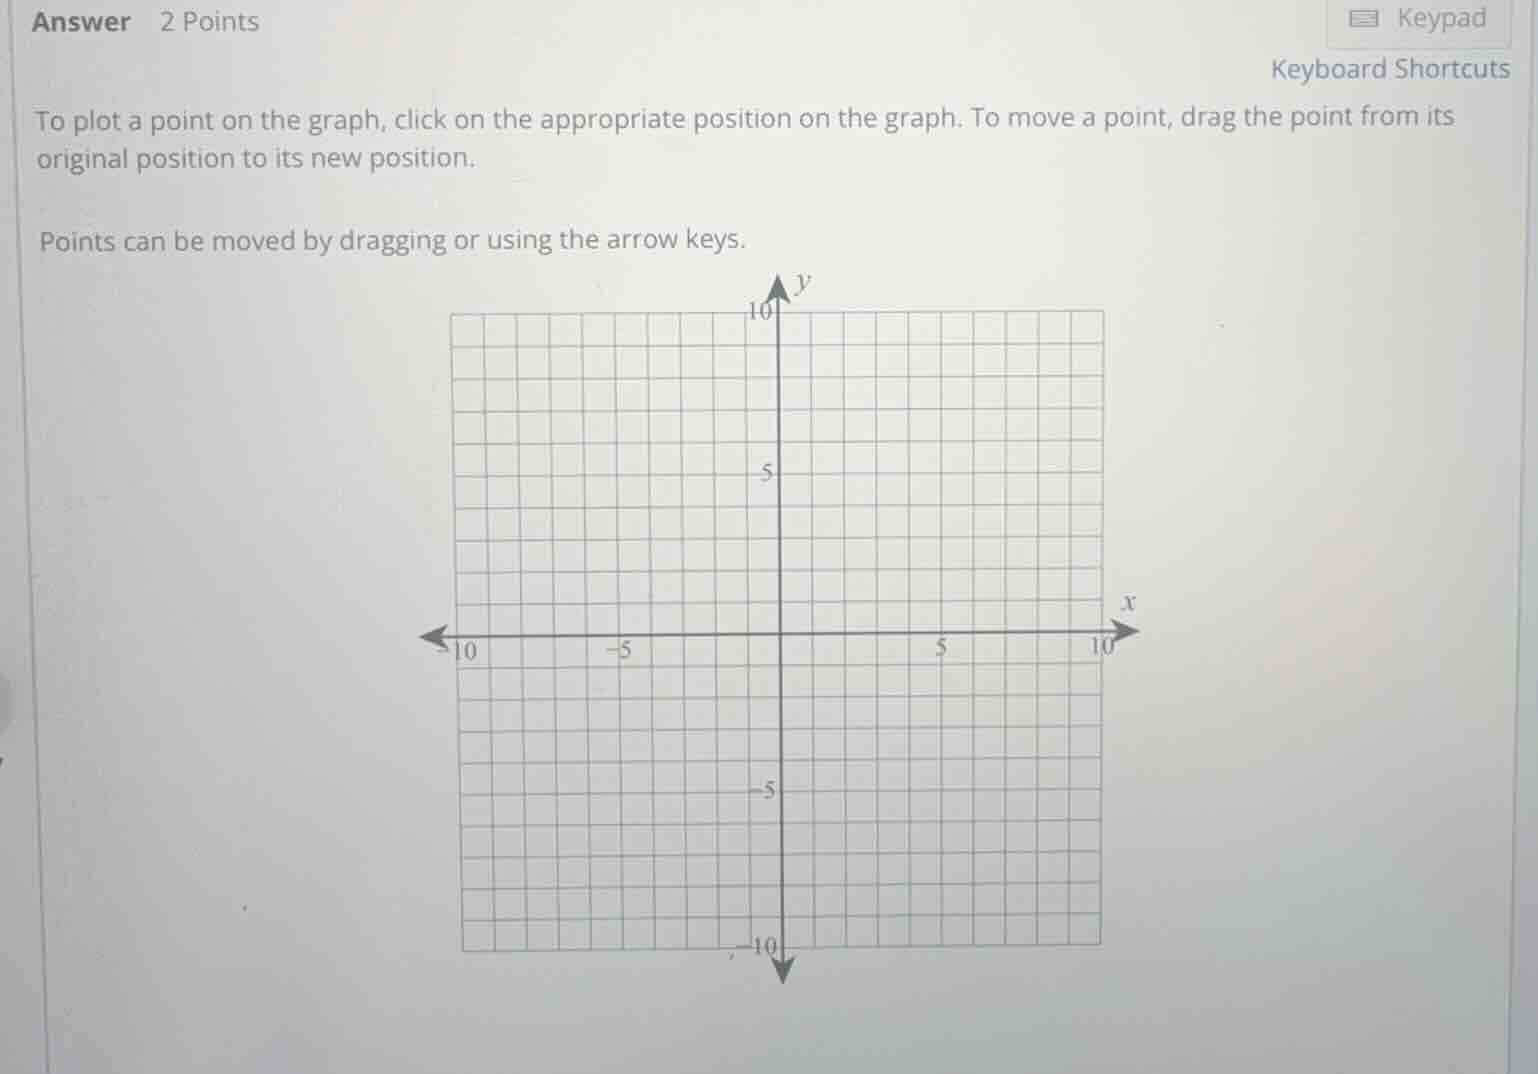
The problem asks to plot points on the graph, but the specific coordinates to plot are cropped out of the image. However, the header indicates "Answer 2 Points". We will explain the general method for plotting any two points \(A(x_1, y_1)\) and \(B(x_2, y_2)\) on a Cartesian plane.
Understand the coordinate axes
Using the Cartesian Coordinates knowledge point:
- The horizontal axis is the \(x\)-axis.
- The vertical axis is the \(y\)-axis.
- The intersection is the origin \((0,0)\).
Locate the coordinates
Using the Plotting Points knowledge point:
- To plot a point \((x, y)\), start at the origin \((0,0)\).
- Move horizontally along the \(x\)-axis by \(x\) units (right if positive, left if negative).
- Move vertically parallel to the \(y\)-axis by \(y\) units (up if positive, down if negative).
- Mark the final position with a point.

Snap & solve any problem in the app
Get step-by-step solutions on Sovi AI
Photo-based solutions with guided steps
Explore more problems and detailed explanations
To plot the two points on the coordinate plane:
- Start at the origin \((0,0)\).
- For each point \((x, y)\), move horizontally to the value of \(x\), then vertically to the value of \(y\).
- Click on the grid to place the points at those exact intersections.