QUESTION IMAGE
Question
Question was provided via image upload.
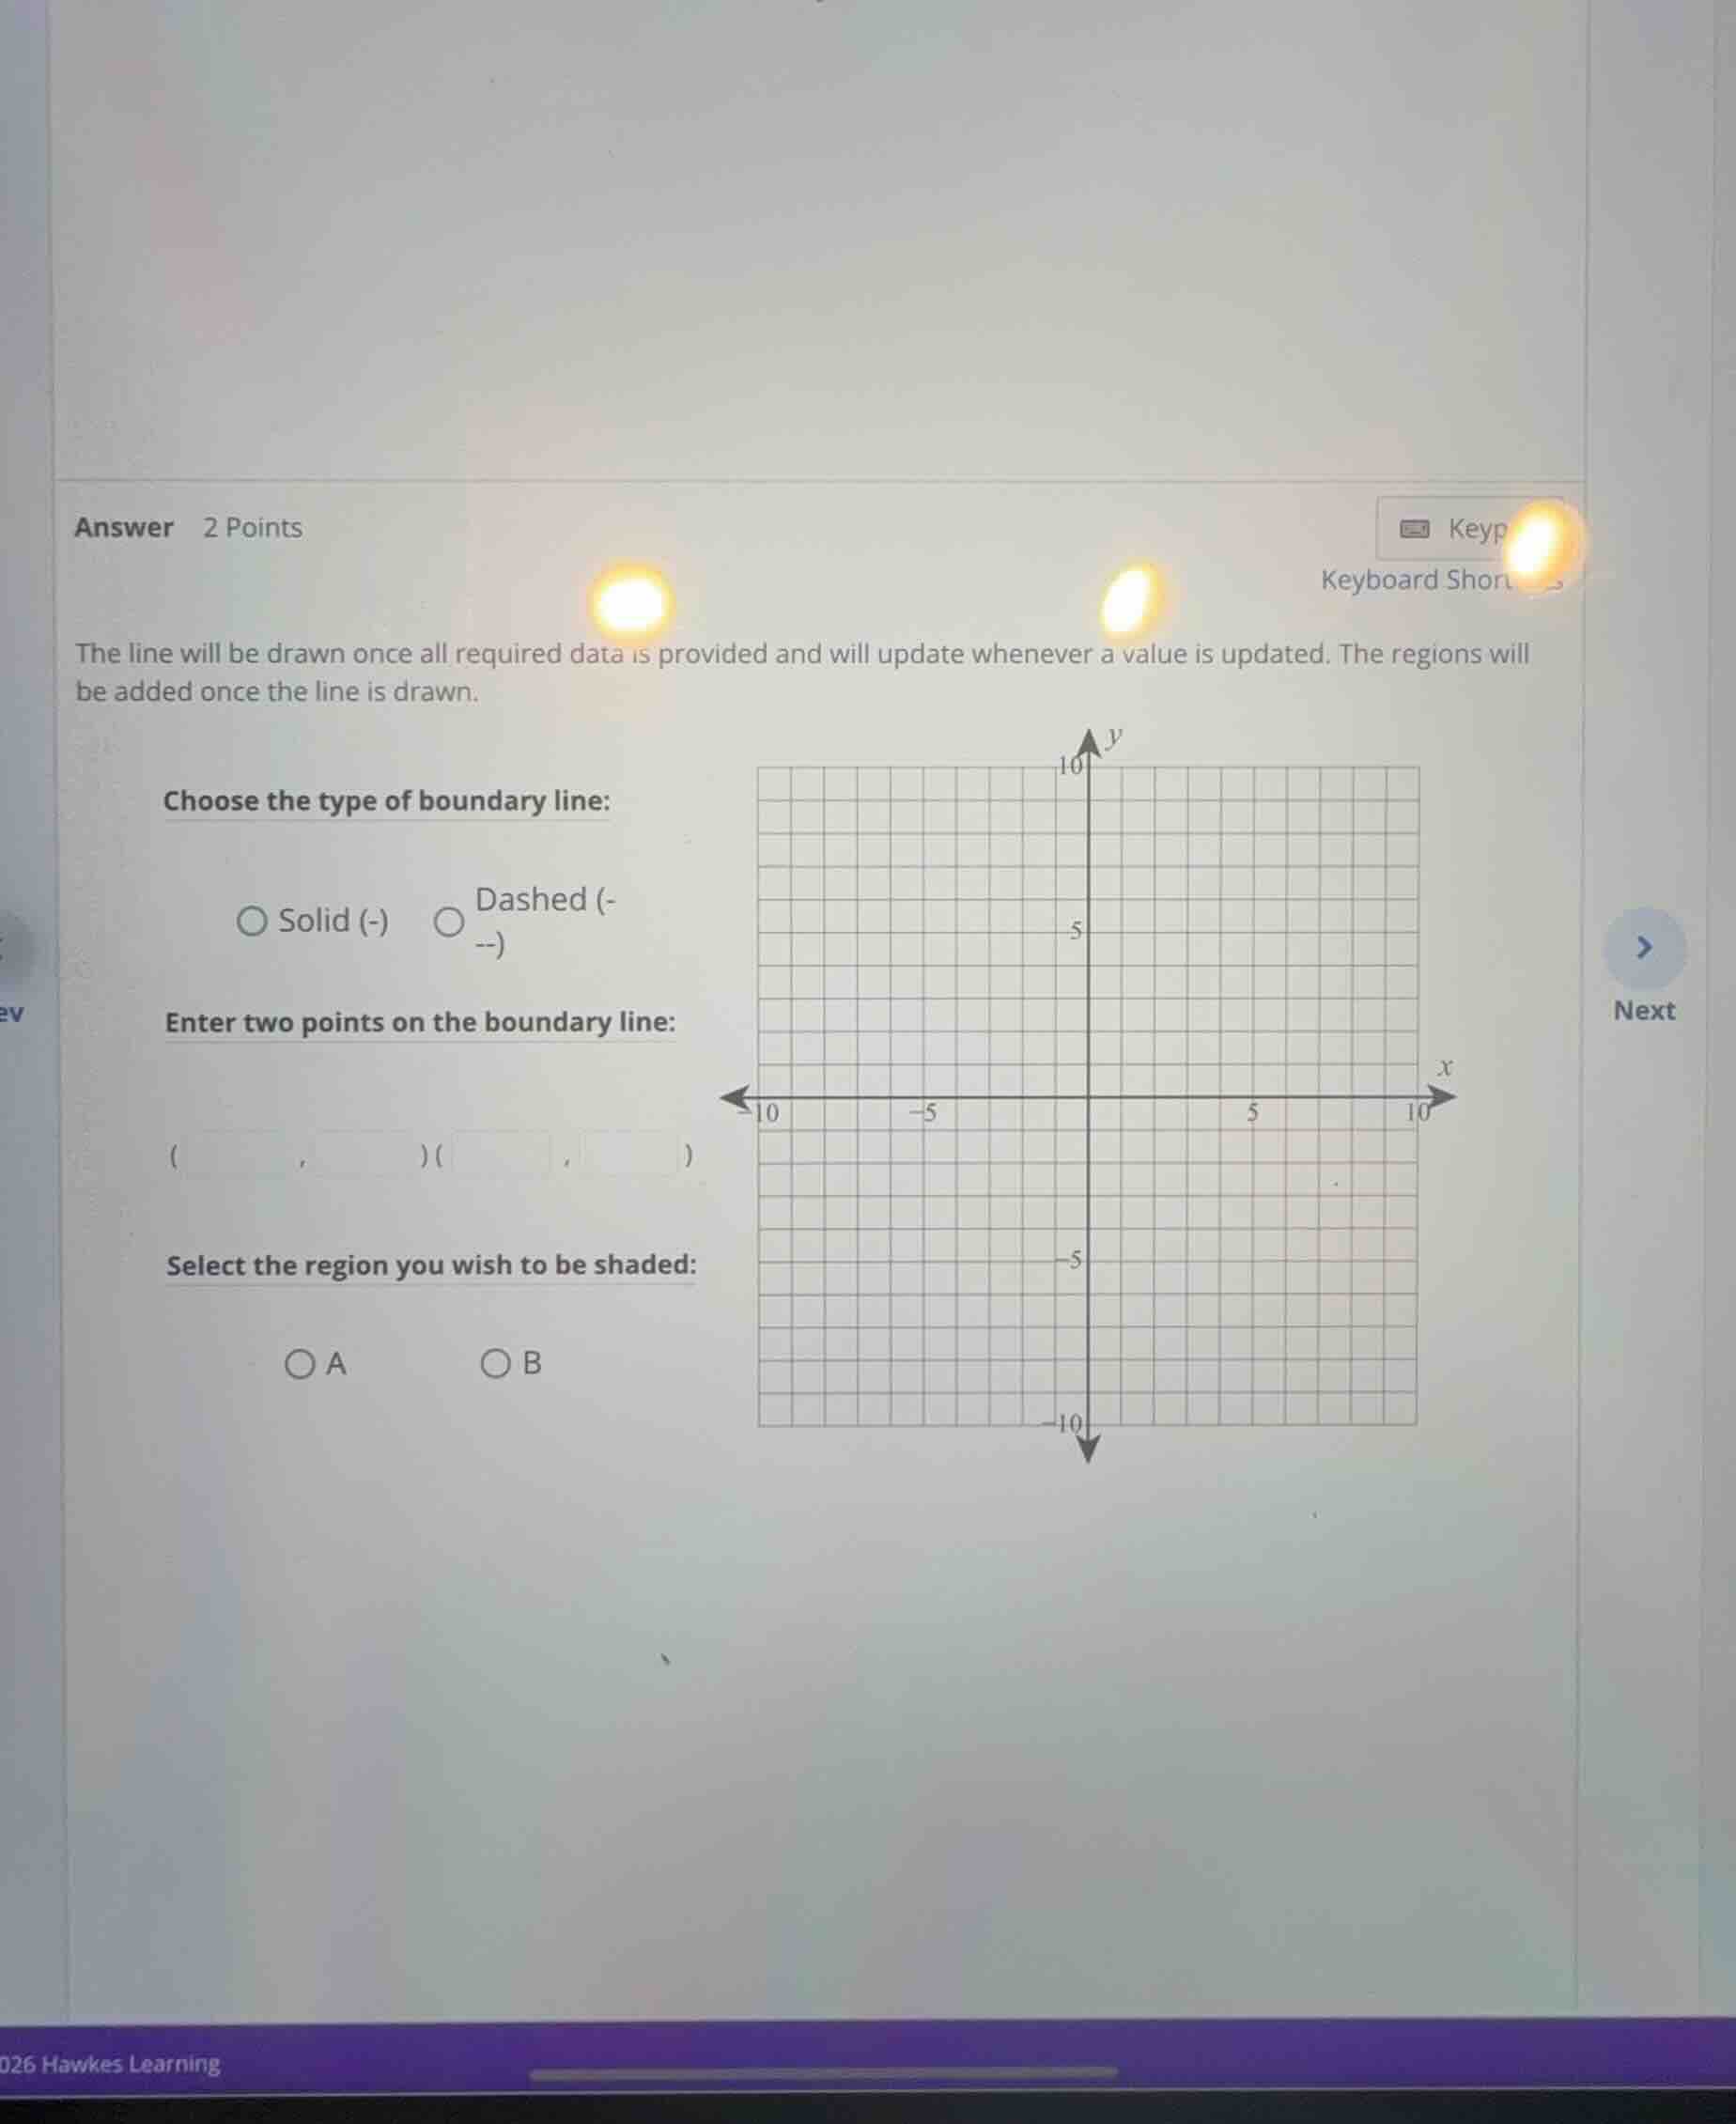
Identify the missing inequality
The image shows a graphing interface for a linear inequality in two variables, but the specific inequality equation/expression is cut off or not visible in the frame. To provide a complete and helpful guide, we will explain the general step-by-step process for graphing any linear inequality of the form \(ax + by < c\), \(ax + by \le c\), \(ax + by > c\), or \(ax + by \ge c\) using the Graphing Linear Inequalities in Two Variables concept.
Determine the boundary line type
The first step is to look at the inequality symbol:
- If the inequality uses strict inequality symbols (\(<\) or \(>\)), the boundary line is not included in the solution set. Therefore, choose Dashed.
- If the inequality uses non-strict inequality symbols (\(\le\) or \(\ge\)), the boundary line is included in the solution set. Therefore, choose Solid.
Find two points on the boundary line
To graph the boundary line, treat the inequality as an equation: \(ax + by = c\). Find any two points that satisfy this equation.
- A common method is to find the intercepts:
- Set \(x = 0\) and solve for \(y\) to get the y-intercept: \((0, y_1)\).
- Set \(y = 0\) and solve for \(x\) to get the x-intercept: \((x_1, 0)\).
- Enter these two coordinate pairs into the input fields: \((x_1, y_1)\) and \((x_2, y_2)\).
Determine the shaded region
To decide which side of the boundary line to shade (Region A or Region B):
- Choose a test point not on the boundary line. The easiest test point is usually the origin, \((0,0)\).
- Substitute the coordinates of the test point into the original inequality:
- If the resulting statement is true, shade the region containing the test point.
- If the resulting statement is false, shade the opposite region (the one that does not contain the test point).

Snap & solve any problem in the app
Get step-by-step solutions on Sovi AI
Photo-based solutions with guided steps
Explore more problems and detailed explanations
Because the specific inequality expression is not visible in the provided image, here is how to complete each step of the problem once you have the inequality:
- Choose the type of boundary line:
- Select Dashed if the inequality has \(<\) or \(>\).
- Select Solid if the inequality has \(\le\) or \(\ge\).
- Enter two points on the boundary line:
- Replace the inequality sign with an equals sign (\(=\)) to get the line equation.
- Find any two points \((x_1, y_1)\) and \((x_2, y_2)\) that satisfy this equation (for example, by finding the \(x\)- and \(y\)-intercepts) and enter them.
- Select the region to be shaded:
- Test the point \((0,0)\) in your original inequality.
- If \((0,0)\) makes the inequality true, select the region containing \((0,0)\).
- If \((0,0)\) makes the inequality false, select the other region.