QUESTION IMAGE
Question
Question was provided via image upload.
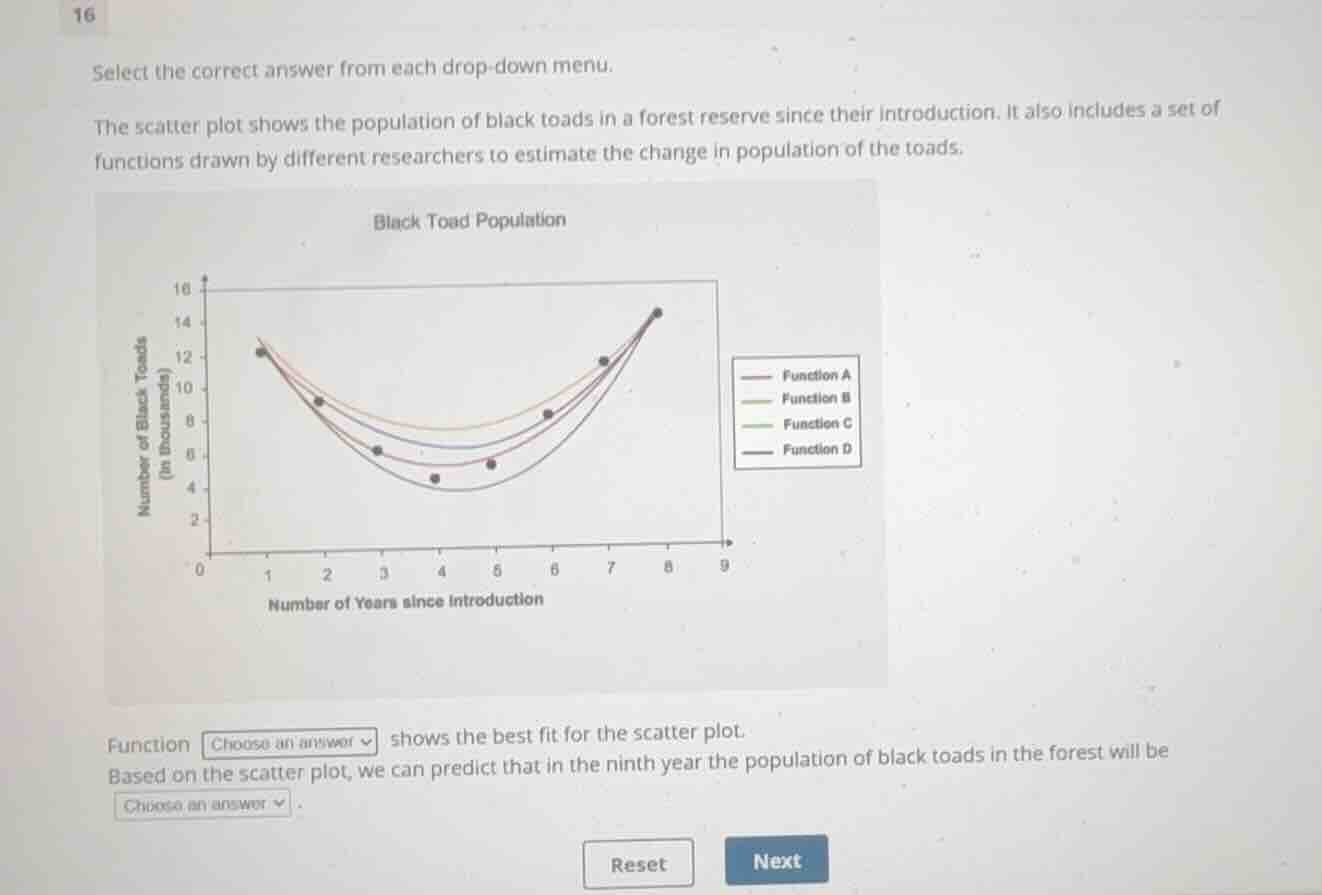
Identify the function of best fit
Analyze the scatter plot points relative to the four curves:
- The data points are: \((1, 12.2)\), \((2, 9.2)\), \((3, 6.2)\), \((4, 4.6)\), \((5, 5.4)\), \((6, 8.4)\), \((7, 11.6)\), \((8, 14.6)\).
- Function B (orange/yellow curve) lies entirely above almost all data points.
- Function A (red curve) lies slightly above the minimum points at \(x=4, 5\).
- Function D (dark blue/purple curve) lies below most points at \(x=3, 4, 5, 6\).
- Function C (green/teal curve) passes directly through or closest to the center of the scatter of points across the entire domain.
Predict the population in the ninth year
- Follow the trend of the best-fitting curve (Function C) or the general upward trajectory of the data points.
- At \(x = 8\), the population is approximately \(14.6\) thousand.
- The curve is increasing rapidly from \(x = 5\) to \(x = 8\).
- Extending the trend to \(x = 9\), the value on the vertical axis (Number of Black Toads in thousands) will be higher than \(14.6\), reaching approximately \(18\) thousand (or \(18,000\)).

Snap & solve any problem in the app
Get step-by-step solutions on Sovi AI
Photo-based solutions with guided steps
Explore more problems and detailed explanations
Function <blank>C</blank> shows the best fit for the scatter plot.
Based on the scatter plot, we can predict that in the ninth year the population of black toads in the forest will be <blank>18,000</blank> (or <blank>18 thousand</blank>).