QUESTION IMAGE
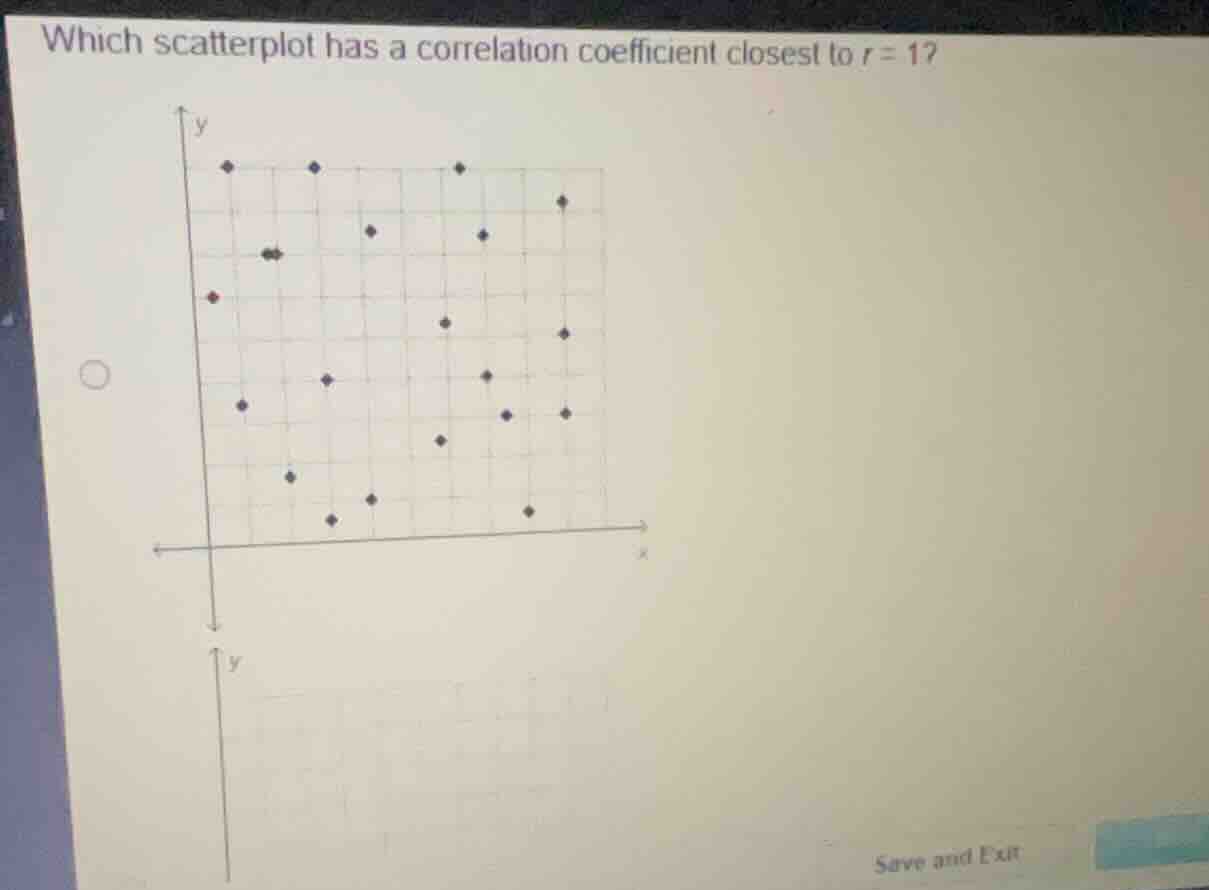
Question
Question was provided via image upload.
Analyze the definition of a correlation coefficient near 1
A correlation coefficient of \(r = 1\) represents a perfect positive linear relationship, where all data points lie exactly on a straight line with a positive slope. A value closest to \(r = 1\) means the scatterplot shows a strong, positive linear trend where the points are tightly clustered around an upward-sloping line.
Evaluate the visible scatterplot
The visible scatterplot shows points widely scattered across the grid with no clear linear trend, representing a correlation coefficient close to \(r = 0\). Since the other options are cut off in the image, the correct scatterplot is the one among the choices that shows the strongest positive linear pattern (points tightly clustered and rising from left to right).

Snap & solve any problem in the app
Get step-by-step solutions on Sovi AI
Photo-based solutions with guided steps
Explore more problems and detailed explanations
The scatterplot with a correlation coefficient closest to \(r = 1\) is the one that displays the strongest positive linear trend, where the points are tightly clustered and rise from left to right to form a nearly straight line.
(Note: The visible scatterplot in the image shows a very weak or near-zero correlation, so the correct option is one of the other choices that are cut off from view.)