QUESTION IMAGE
Question
graphing situations task
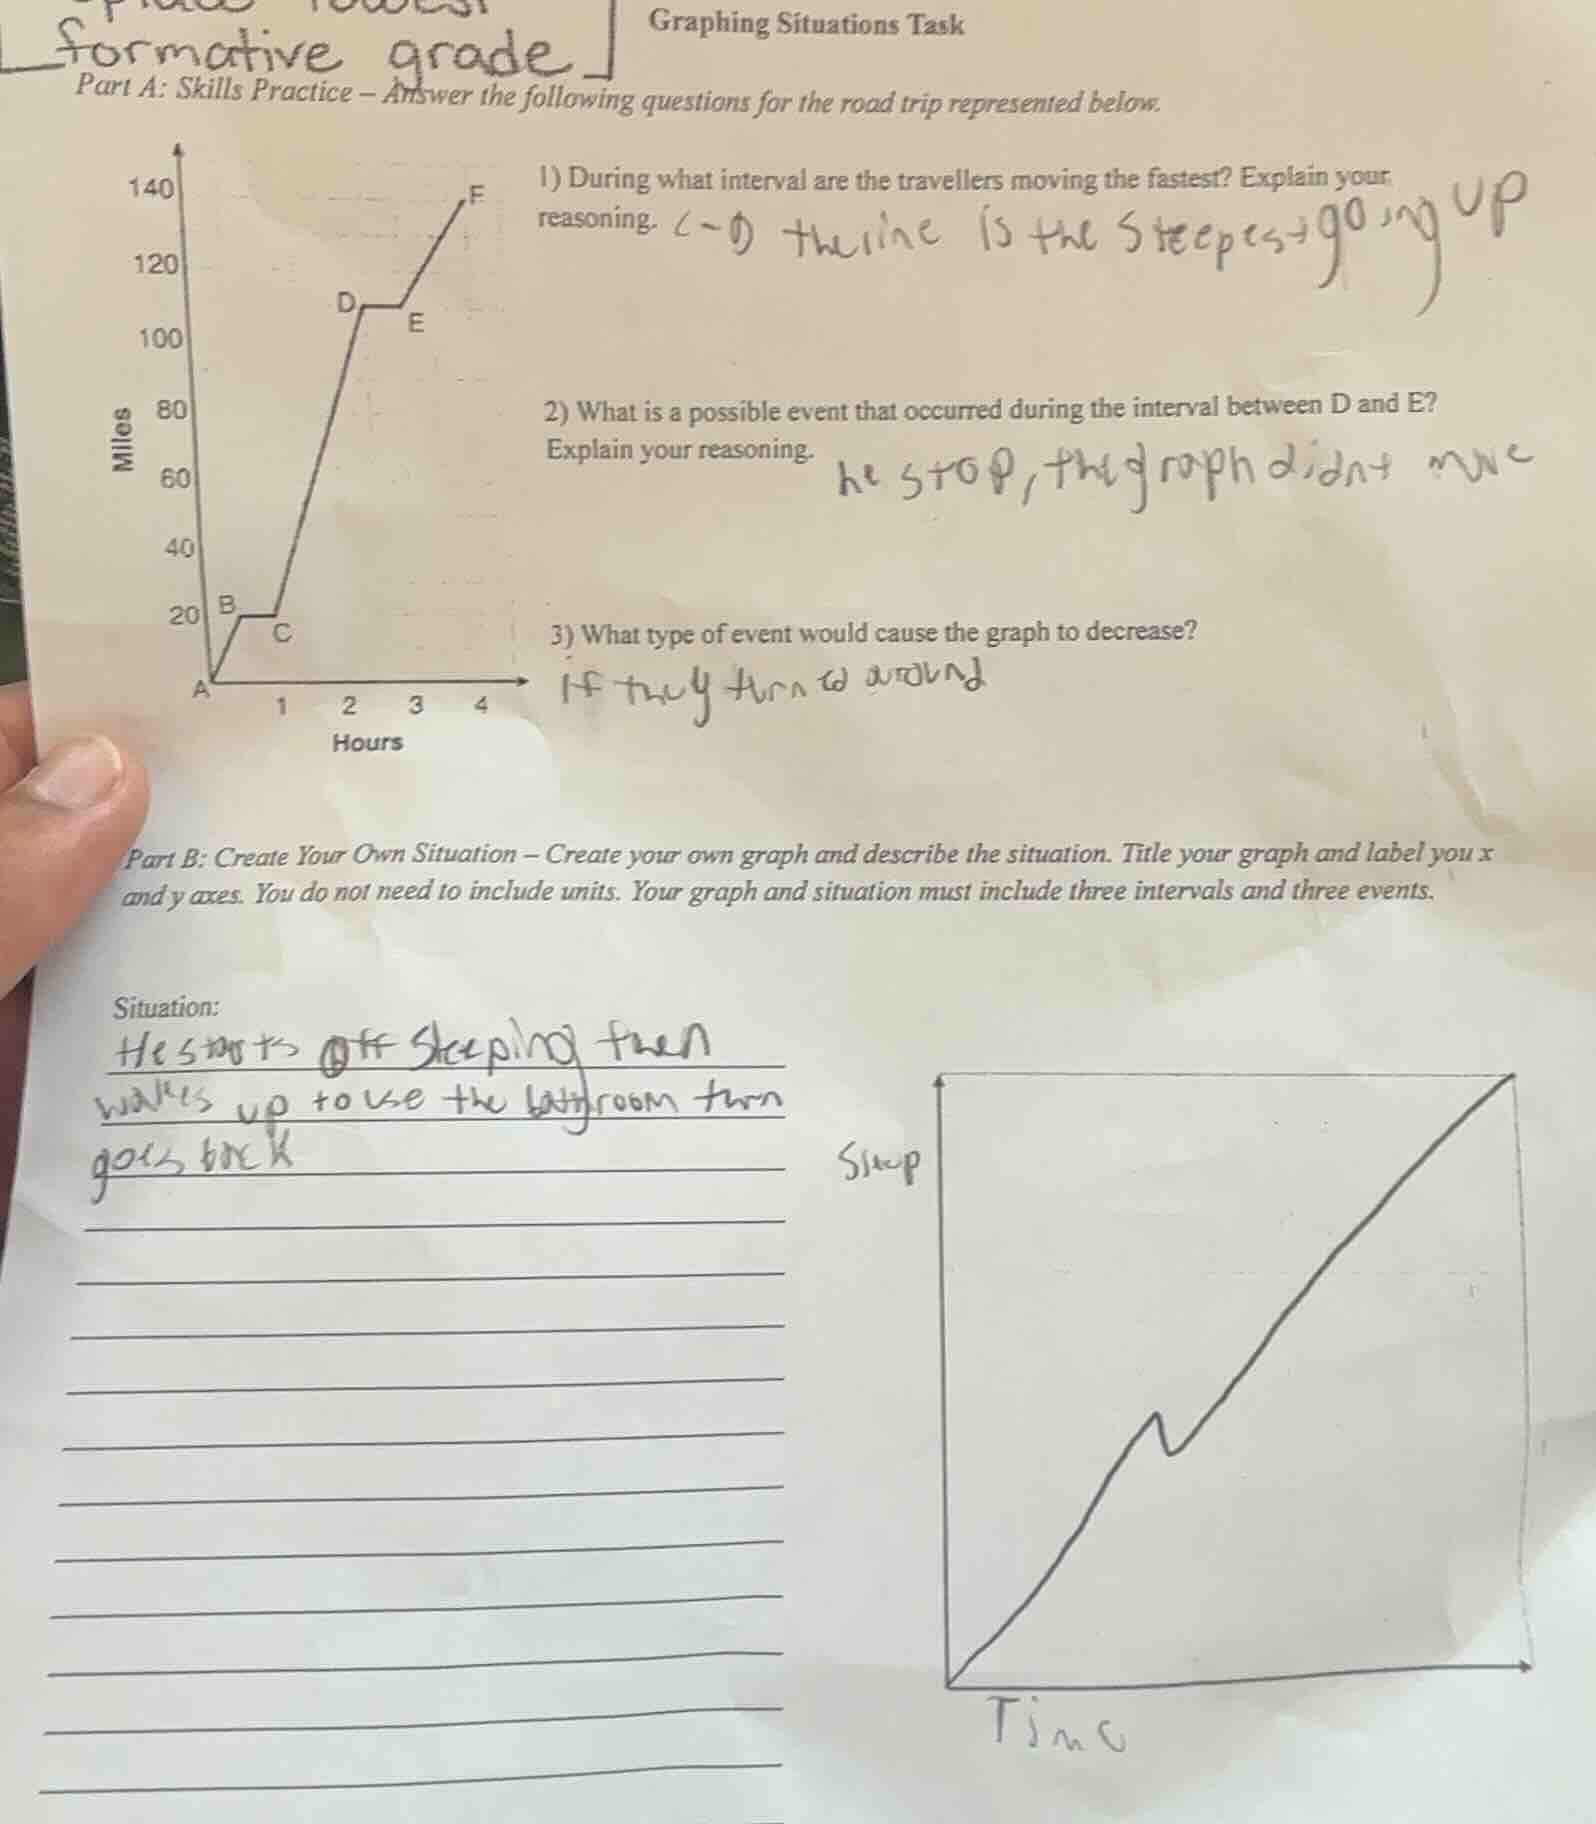
part a: skills practice - answer the following questions for the road trip represented below.
- during what interval are the travellers moving the fastest? explain your reasoning.
- what is a possible event that occurred during the interval between d and e? explain your reasoning.
- what type of event would cause the graph to decrease?
part b: create your own situation - create your own graph and describe the situation. title your graph and label your x and y axes. you do not need to include units. your graph and situation must include three intervals and three events.
Analyze the fastest interval
Using the Distance-Time Graphs and Graph Interpretation knowledge points
- Speed is represented by the slope of each segment.
- Segment \(A-B\): \(\text{slope} = \frac{20 - 0}{0.5 - 0} = 40\text{ mph}\).
- Segment \(B-C\): \(\text{slope} = 0\text{ mph}\).
- Segment \(C-D\): \(\text{slope} = \frac{110 - 20}{2 - 1} = 90\text{ mph}\).
- Segment \(D-E\): \(\text{slope} = 0\text{ mph}\).
- Segment \(E-F\): \(\text{slope} = \frac{140 - 110}{4 - 3} = 30\text{ mph}\).
- The steepest positive slope is interval \(C-D\).
Analyze the horizontal interval D to E
Using the Distance-Time Graphs and Qualitative Graphs knowledge points
- The distance remains constant at 110 miles from hour 2 to hour 3.
- A constant distance over time means speed is zero.
- This represents a stop, such as resting, eating, or refueling.
Analyze decreasing distance-time graphs
Using the Distance-Time Graphs and Qualitative Graphs knowledge points
- A decreasing line means distance from the starting point is decreasing.
- This indicates the travelers are moving back toward the start.
- An event causing this is turning around or heading home.

Snap & solve any problem in the app
Get step-by-step solutions on Sovi AI
Photo-based solutions with guided steps
Explore more problems and detailed explanations
Question 1
The travelers are moving the fastest during the interval C–D. This is because the line segment has the steepest slope, representing the highest speed of \(90\text{ miles per hour}\).
Question 2
A possible event during the interval D to E is a stop for lunch, a rest break, or refueling the vehicle. This is because the distance does not change, meaning the travelers are stationary.
Question 3
An event that would cause the graph to decrease is turning around and driving back toward the starting location.