QUESTION IMAGE
Question
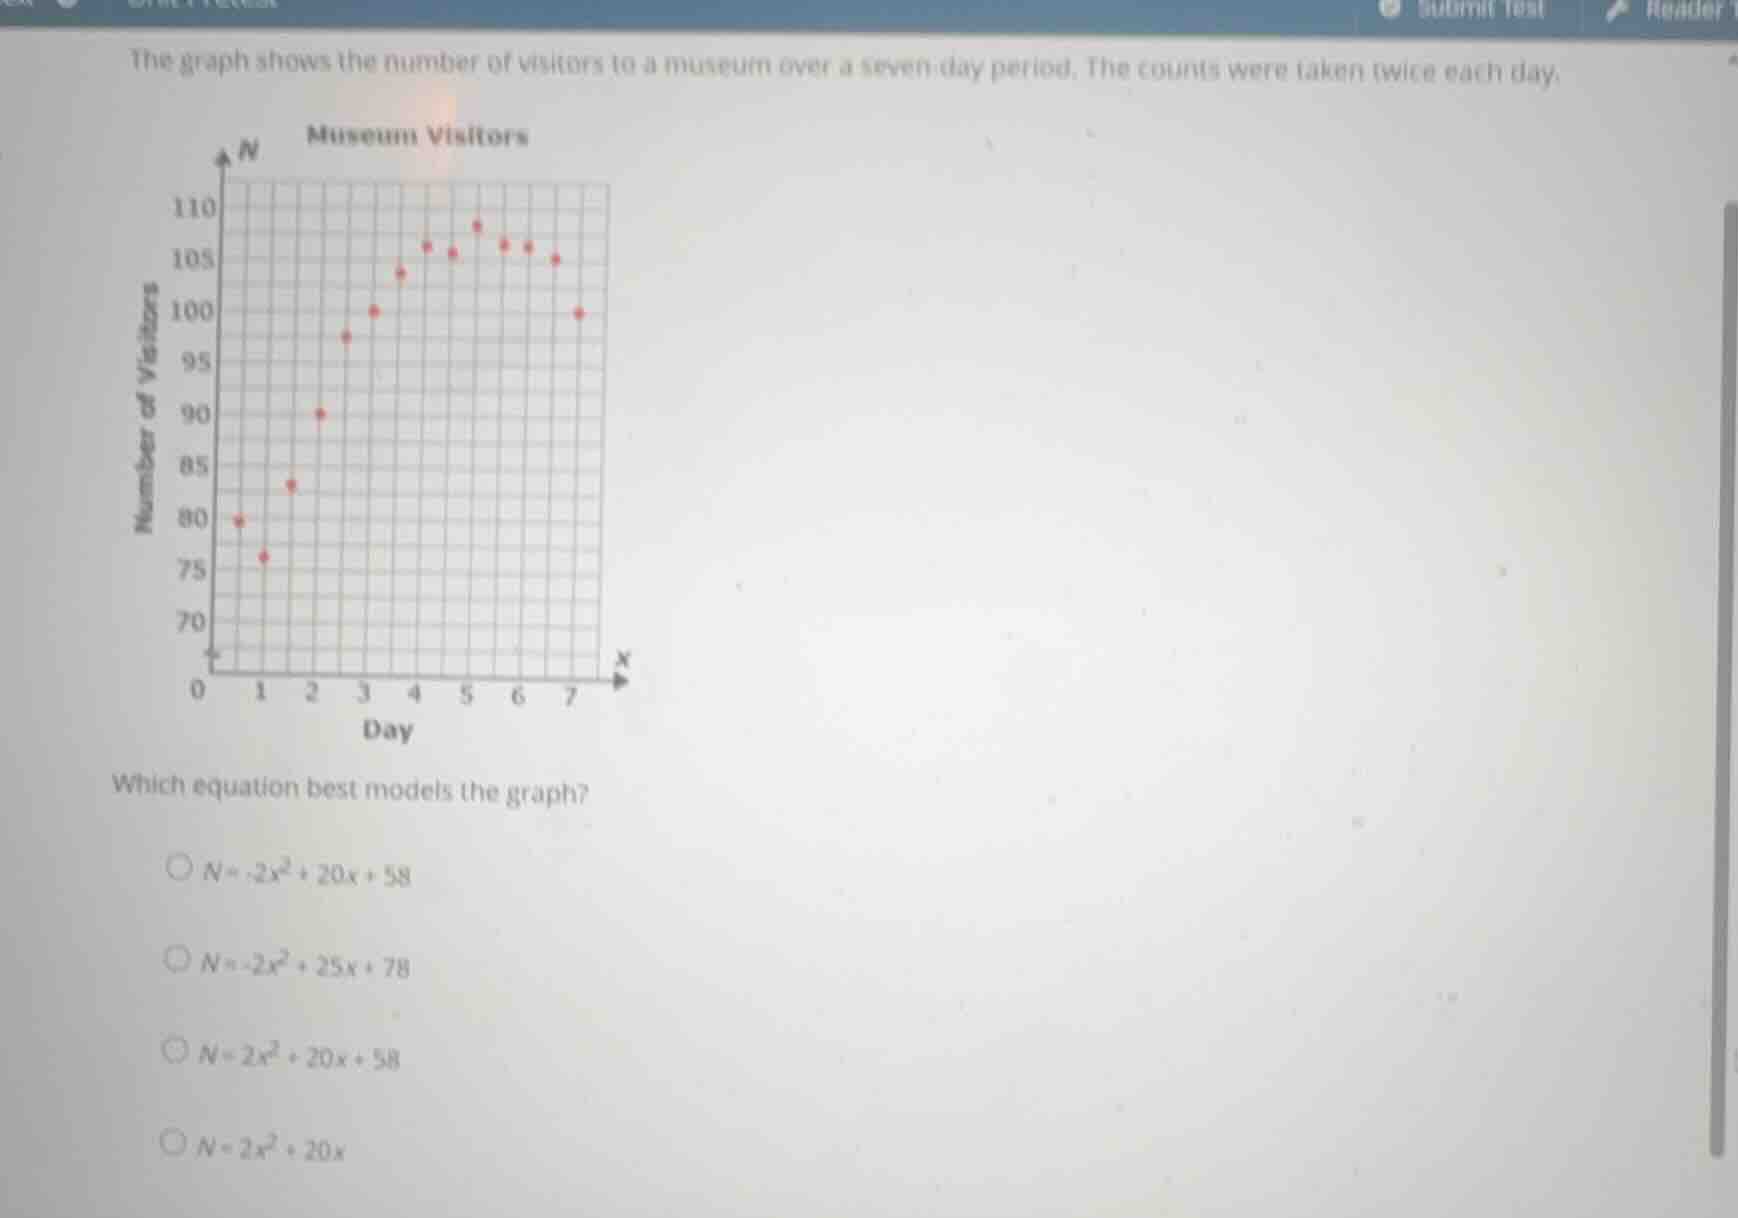
the graph shows the number of visitors to a museum over a seven-day period. the counts were taken twice each day.
which equation best models the graph?
\\(n = -2x^2 + 20x + 58\\)
\\(n = -2x^2 + 25x + 78\\)
\\(n = 2x^2 + 20x + 58\\)
\\(n = 2x^2 + 20x\\)
Identify key features of the graph
$$
LATEXBLOCK0
$$
Evaluate the given options at key points
$$
LATEXBLOCK1
$$
Determine the best fitting model
$$
LATEXBLOCK2
$$

Snap & solve any problem in the app
Get step-by-step solutions on Sovi AI
Photo-based solutions with guided steps
Explore more problems and detailed explanations
- (A) \(N = -2x^2 + 20x + 58\) (Correct answer)
- (B) \(N = -2x^2 + 25x + 78\)
- (C) \(N = 2x^2 + 20x + 58\)
- (D) \(N = 2x^2 + 20x\)