QUESTION IMAGE
Question
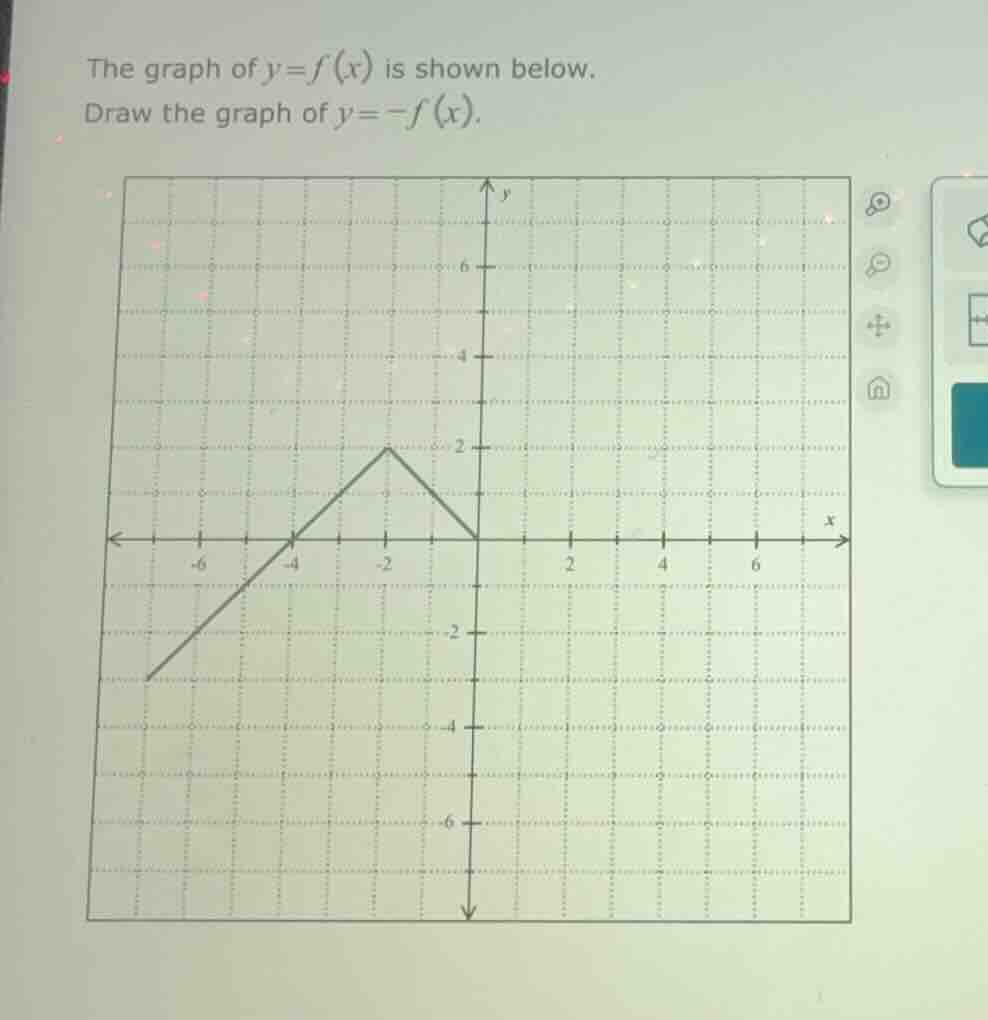
the graph of \\(y=f(x)\\) is shown below.
draw the graph of \\(y=-f(x)\\).
Identify key points of the original graph
The original graph of \(y = f(x)\) is a piecewise linear function. We can identify its key vertices and endpoints from the grid:
- Left endpoint: \((-7, -3)\)
- First turning point: \((-2, 2)\)
- Right endpoint: \((0, 0)\)
Apply the transformation rule
To graph \(y = -f(x)\), we reflect the graph of \(y = f(x)\) vertically across the \(x\)-axis. This transformation negates the \(y\)-coordinate of every point on the graph while keeping the \(x\)-coordinate the same:
Calculate the transformed key points
Applying the reflection rule \((x, -y)\) to our identified key points:
- \((-7, -3)
ightarrow (-7, 3)\)
- \((-2, 2)
ightarrow (-2, -2)\)
- \((0, 0)
ightarrow (0, 0)\)
Connect the transformed points
Draw straight line segments connecting the new key points in order:
- A line segment from \((-7, 3)\) to \((-2, -2)\).
- A line segment from \((-2, -2)\) to \((0, 0)\).

Snap & solve any problem in the app
Get step-by-step solutions on Sovi AI
Photo-based solutions with guided steps
Explore more problems and detailed explanations
To draw the graph of \(y = -f(x)\), reflect the original graph vertically across the \(x\)-axis by negating the \(y\)-coordinates of its key points:
- The point \((-7, -3)\) becomes \((-7, 3)\).
- The point \((-2, 2)\) becomes \((-2, -2)\).
- The point \((0, 0)\) remains \((0, 0)\).
Plot these points and connect them with straight line segments: from \((-7, 3)\) to \((-2, -2)\), and from \((-2, -2)\) to \((0, 0)\).