QUESTION IMAGE
Question
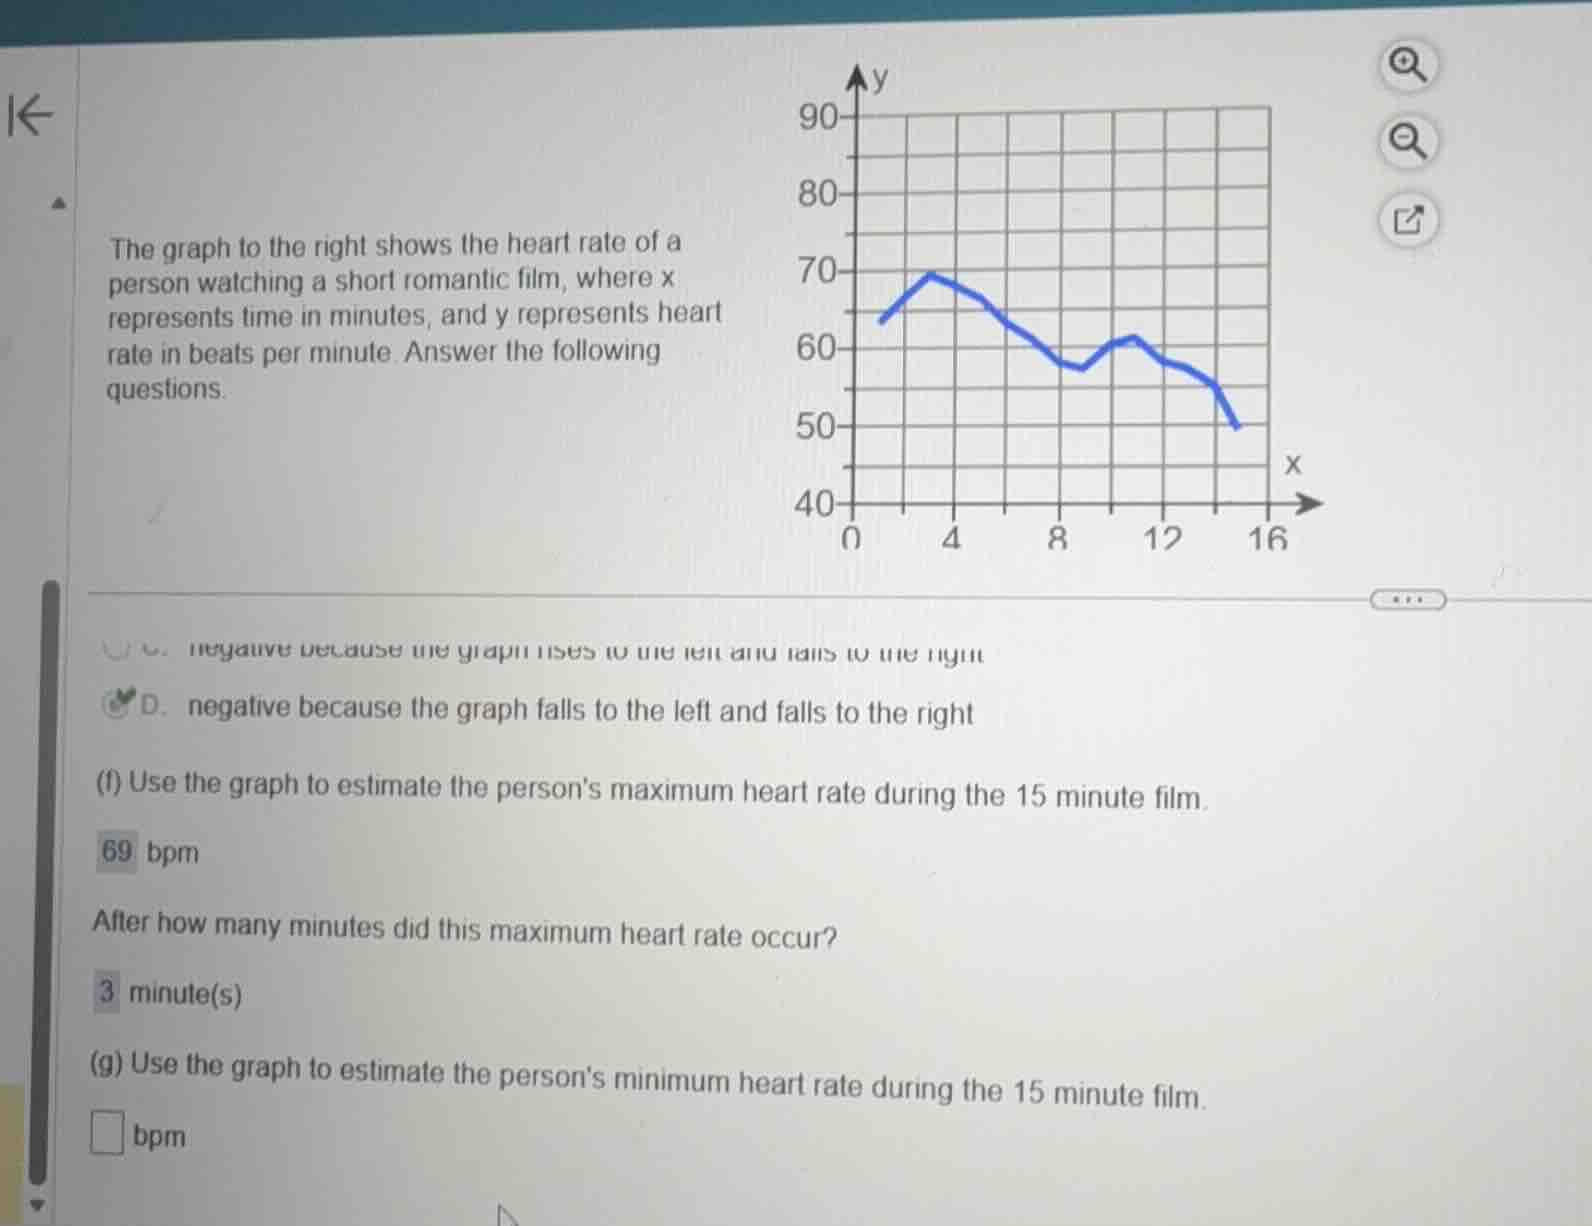
the graph to the right shows the heart rate of a person watching a short romantic film, where x represents time in minutes, and y represents heart rate in beats per minute. answer the following questions.
(f) use the graph to estimate the persons maximum heart rate during the 15 minute film.
69 bpm
after how many minutes did this maximum heart rate occur?
3 minute(s)
(g) use the graph to estimate the persons minimum heart rate during the 15 minute film.
bpm
Identify the target value
We need to find the minimum heart rate during the 15-minute film using Graph Interpretation.
Locate the lowest point
Using Graph Interpretation, we look for the lowest y-value on the blue curve between \(x = 0\) and \(x = 15\).
Read the coordinates
The curve ends at \(x = 15\). At this point, the curve reaches its lowest level.
Determine the y-value
Using Graph Interpretation, the grid line for \(y = 50\) aligns exactly with the end of the curve at \(x = 15\).
State the final estimate
The estimated minimum heart rate is \(50\) bpm.

Snap & solve any problem in the app
Get step-by-step solutions on Sovi AI
Photo-based solutions with guided steps
Explore more problems and detailed explanations
(g) Use the graph to estimate the person's minimum heart rate during the 15 minute film.
<blank>50</blank> bpm