QUESTION IMAGE
Question
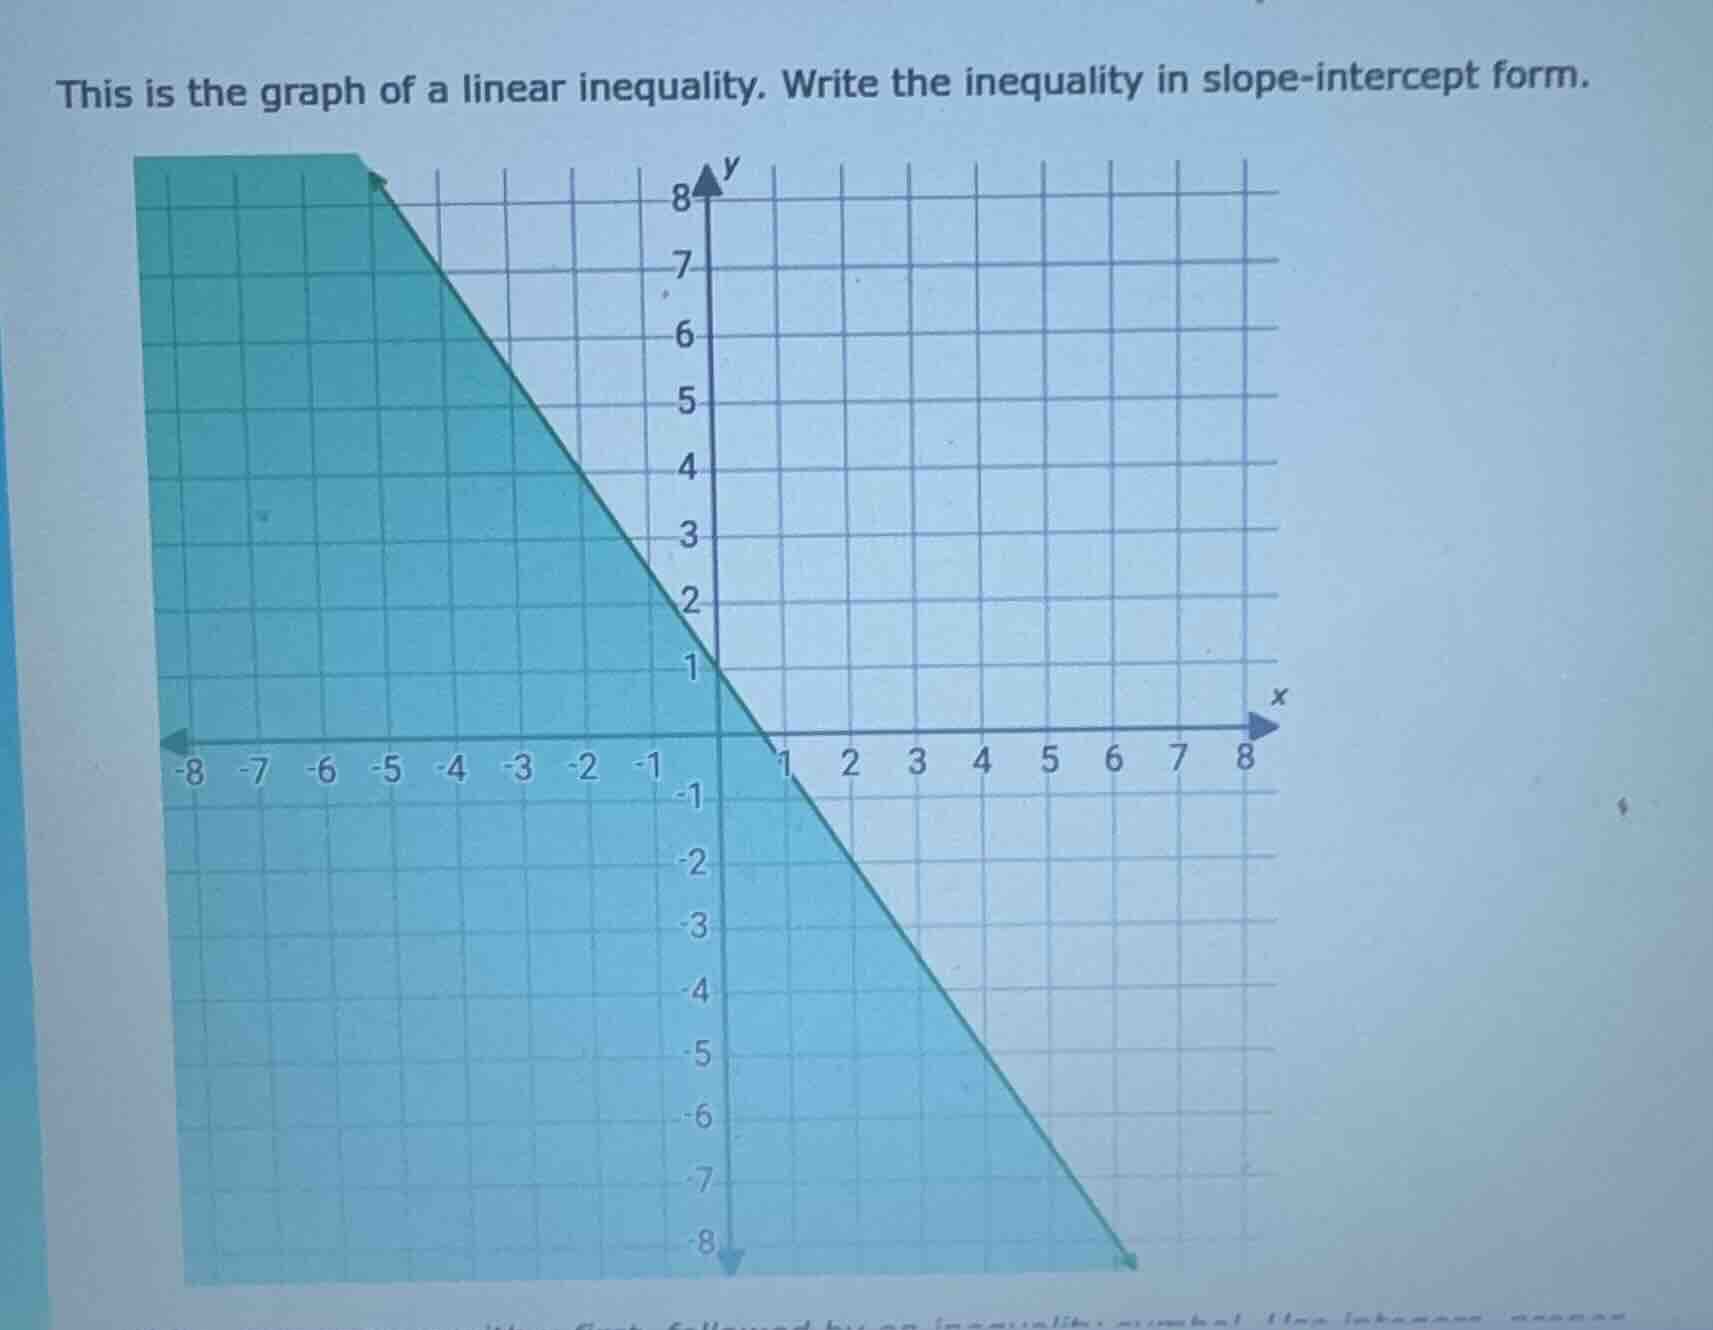
this is the graph of a linear inequality. write the inequality in slope - intercept form.
Step1: Find the slope-intercept form of the line
First, identify two points on the line. From the graph, we can see that the line passes through \((0, 1)\) and \((1, 0)\). The slope \(m\) is calculated as \(m=\frac{y_2 - y_1}{x_2 - x_1}=\frac{0 - 1}{1 - 0}=- 1\). The \(y\)-intercept \(b\) is \(1\) (since the line crosses the \(y\)-axis at \((0,1)\)). So the equation of the line in slope - intercept form (\(y = mx + b\)) is \(y=-x + 1\).
Step2: Determine the inequality symbol
The line is solid (since the boundary is included in the solution set, we can tell from the graph's line style, although in the given graph it looks like a solid line? Wait, looking at the graph, the line is a solid line? Wait, no, wait the shading: the shaded region. Let's check the direction of the inequality. Let's pick a test point, say \((0,0)\). Plug into \(y=-x + 1\), we get \(0\)? \(0\) vs \(-0 + 1=1\). \(0<1\), but is \((0,0)\) in the shaded region? Wait, looking at the graph, the shaded region: when \(x = 0\), \(y\) values less than \(1\) and greater than \(1\)? Wait, no, let's re - examine the graph. Wait, the line goes from \((-5,8)\) (wait, no, earlier points: wait, when \(x=-5\), \(y = 8\)? Wait, maybe my initial points were wrong. Let's take two clear points. Let's see, when \(x = 0\), \(y=1\); when \(x = 1\), \(y = 0\); when \(x=2\), \(y=-1\); when \(x=-1\), \(y = 2\). So the slope is still \(-1\), \(y\)-intercept \(1\). Now, the shaded region: let's take a point in the shaded region, say \((-5,8)\). Plug into \(y=-x + 1\): \(8\) vs \(-(-5)+1=5 + 1=6\). \(8>6\). So the inequality is \(y\geq - x+1\)? Wait, no, wait \((-5,8)\): \(y = 8\), \(-x + 1=5 + 1 = 6\), \(8>6\). Wait, but when \(x = 0\), the \(y\)-intercept is \(1\). Wait, maybe the line is \(y=-x + 1\), and the shaded region is above the line? Wait, no, let's check the shading again. Wait, the graph's shaded area: when \(x\) decreases (goes to the left), \(y\) increases, and when \(x\) increases, \(y\) decreases. Let's take the point \((0,0)\): is \((0,0)\) in the shaded region? Looking at the graph, the shaded region at \(x = 0\) includes \(y\) values from, say, below \(1\) and above \(1\)? No, wait, the line is \(y=-x + 1\). Let's check the test point \((-2,3)\). Plug into \(y=-x + 1\): \(3\) vs \(-(-2)+1=2 + 1=3\). So \((-2,3)\) is on the line? Wait, no, \(-2\) plugged into \(y=-x + 1\) gives \(y = 3\), so \((-2,3)\) is on the line. Wait, maybe the line is \(y=-x + 1\) and the inequality is \(y\geq - x + 1\)? Wait, no, let's re - do the slope. Let's take two points: \((x_1,y_1)=(-5,8)\) and \((x_2,y_2)=(3,-2)\). Then slope \(m=\frac{y_2 - y_1}{x_2 - x_1}=\frac{-2 - 8}{3-(-5)}=\frac{-10}{8}=-\frac{5}{4}\)? Wait, I think I made a mistake earlier. Wait, the graph: let's count the grid. Each grid is 1 unit. So from \((0,1)\) to \((1,0)\): that's a slope of \(-1\). From \((0,1)\) to \((-1,2)\): slope is \(\frac{2 - 1}{-1-0}=-1\). From \((0,1)\) to \((1,0)\): slope \(-1\). Now, the boundary line: is it solid or dashed? The problem says "linear inequality", if the line is solid, the inequality is \(\geq\) or \(\leq\); if dashed, \(\gt\) or \(\lt\). Looking at the graph, the line appears to be solid (since the boundary is included). Now, let's take a test point in the shaded region. Let's take \((-5,8)\): \(y = 8\), \( - x+1=5 + 1 = 6\), \(8>6\). So \(y\geq - x + 1\)? Wait, no, \(8>6\), so \(y\geq - x + 1\) would include \(y = 8\) when \(x=-5\). Wait, but when \(x = 0\), \(y = 1\) is on the line. Let's check another point: \((0,2)\). Plug into \(y=-x + 1\): \(2\) vs \(1\), \(2>1\). Is \((0…

Snap & solve any problem in the app
Get step-by-step solutions on Sovi AI
Photo-based solutions with guided steps
Explore more problems and detailed explanations
\(y\geq -x + 1\)