QUESTION IMAGE
Question
drag each tile to the correct box.
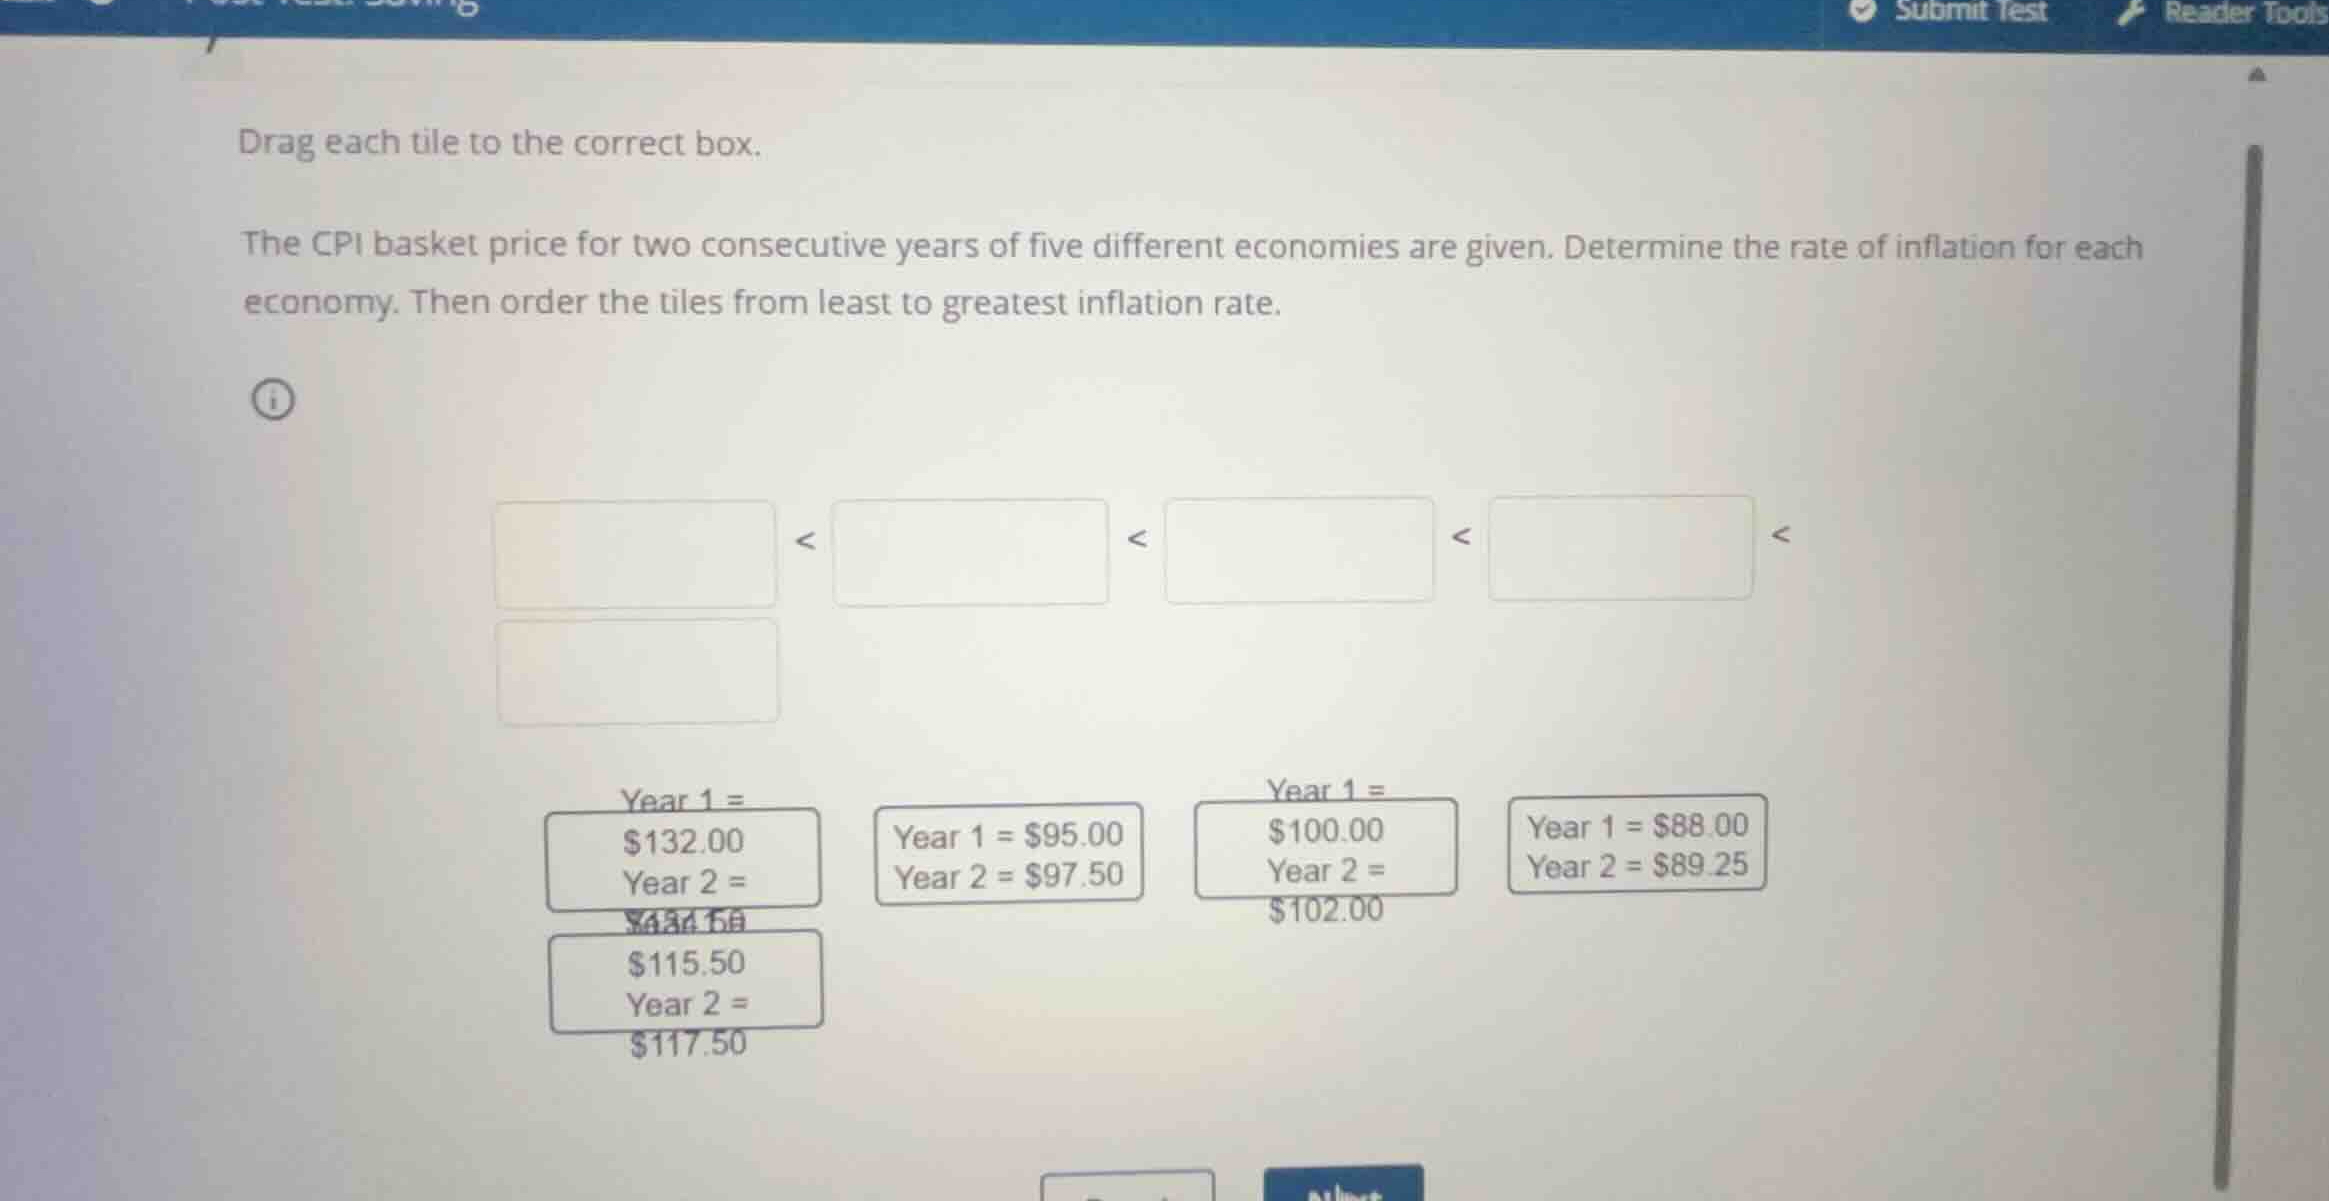
the cpi basket price for two consecutive years of five different economies are given. determine the rate of inflation for each economy. then order the tiles from least to greatest inflation rate.
< < < <
tiles:
- year 1 = $132.00, year 2 = $134.50
- year 1 = $115.50, year 2 = $117.50
- year 1 = $95.00, year 2 = $97.50
- year 1 = $100.00, year 2 = $102.00
- year 1 = $88.00, year 2 = $89.25
Calculate inflation rate for each economy
- Economy A (top-left tile):
Year 1 = \$132.00, Year 2 = \$134.50 (the crossed-out/corrected value is \$134.50)
- Economy B (bottom-left tile):
Year 1 = \$115.50, Year 2 = \$117.50
- Economy C (second tile from left):
Year 1 = \$95.00, Year 2 = \$97.50
- Economy D (third tile from left):
Year 1 = \$100.00, Year 2 = \$102.00
- Economy E (fourth tile from left):
Year 1 = \$88.00, Year 2 = \$89.25
Order the inflation rates from least to greatest
Comparing the calculated rates:
The corresponding order of the tiles is:
- Year 1 = \$88.00, Year 2 = \$89.25 (\(\approx 1.42\%\))
- Year 1 = \$115.50, Year 2 = \$117.50 (\(\approx 1.73\%\))
- Year 1 = \$132.00, Year 2 = \$134.50 (\(\approx 1.89\%\))
- Year 1 = \$100.00, Year 2 = \$102.00 (\(2.00\%\))
- Year 1 = \$95.00, Year 2 = \$97.50 (\(\approx 2.63\%\))

Snap & solve any problem in the app
Get step-by-step solutions on Sovi AI
Photo-based solutions with guided steps
Explore more problems and detailed explanations
The correct order of the tiles from least to greatest inflation rate is:
- First Box (Least):
Year 1 = \$88.00
Year 2 = \$89.25
(Inflation Rate: \(\approx 1.42\%\))
- Second Box:
Year 1 = \$115.50
Year 2 = \$117.50
(Inflation Rate: \(\approx 1.73\%\))
- Third Box:
Year 1 = \$132.00
Year 2 = \$134.50
(Inflation Rate: \(\approx 1.89\%\))
- Fourth Box:
Year 1 = \$100.00
Year 2 = \$102.00
(Inflation Rate: \(2.00\%\))
- Fifth Box (Greatest):
Year 1 = \$95.00
Year 2 = \$97.50
(Inflation Rate: \(\approx 2.63\%\))