QUESTION IMAGE
Question
determining data relationships
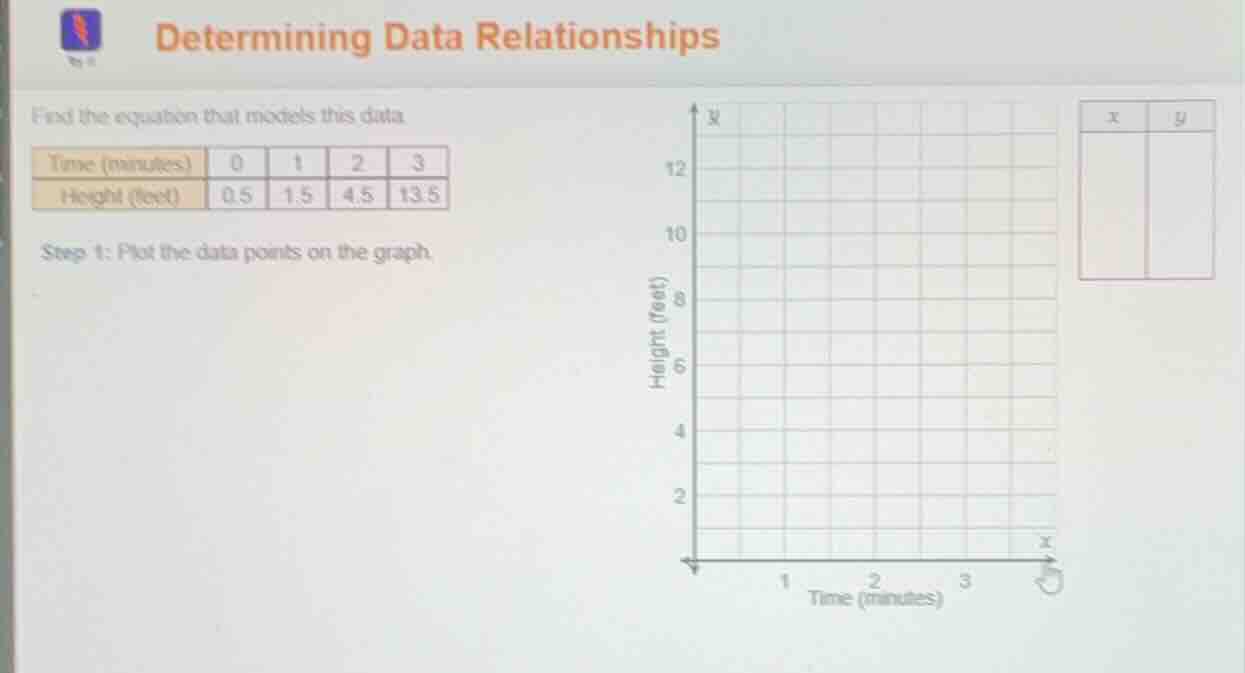
find the equation that models this data.
\
$$\begin{tabular}{|c|c|c|c|c|}
\\hline
time (minutes) & 0 & 1 & 2 & 3 \\\\
\\hline
height (feet) & 0.5 & 1.5 & 4.5 & 13.5 \\\\
\\hline
\\end{tabular}$$
step 1: plot the data points on the graph.
Identify the data pattern
Using the Exponential Modeling knowledge point
$$
LATEXBLOCK0
$$
The ratio of consecutive \(y\)-values is constant:
$$
\frac{1.5}{0.5} = 3, \quad \frac{4.5}{1.5} = 3, \quad \frac{13.5}{4.5} = 3
$$
Determine the exponential equation
Using the Exponential Growth Calculation knowledge point
$$
LATEXBLOCK1
$$

Snap & solve any problem in the app
Get step-by-step solutions on Sovi AI
Photo-based solutions with guided steps
Explore more problems and detailed explanations
The equation that models the given data is:
$$y = 0.5 \cdot 3^x$$