QUESTION IMAGE
Question
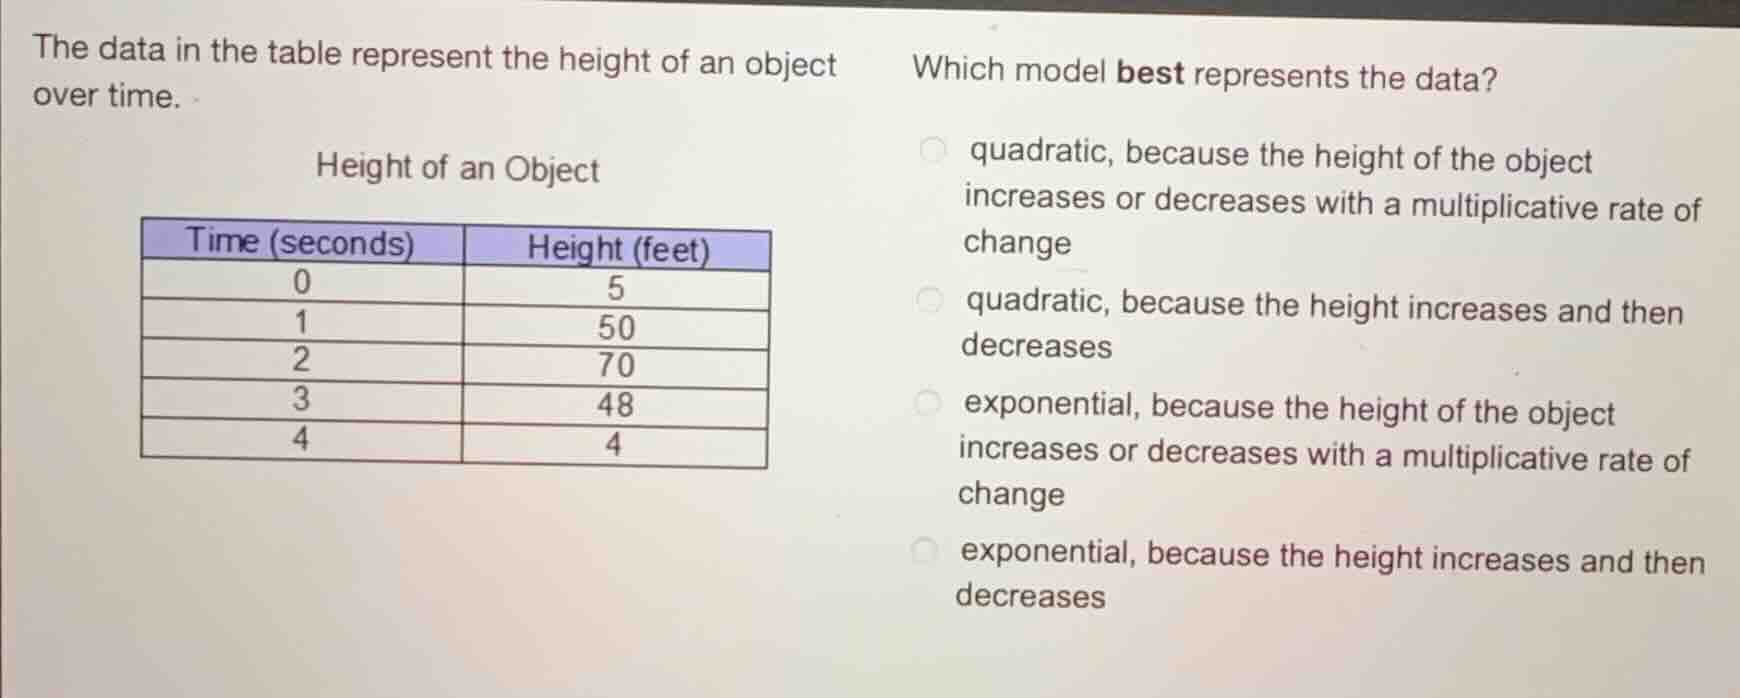
the data in the table represent the height of an object over time.
height of an object
\
$$\begin{array}{|c|c|}
\\hline
\\text{time (seconds)} & \\text{height (feet)} \\\\
\\hline
0 & 5 \\\\
\\hline
1 & 50 \\\\
\\hline
2 & 70 \\\\
\\hline
3 & 48 \\\\
\\hline
4 & 4 \\\\
\\hline
\\end{array}$$
which model best represents the data?
- quadratic, because the height of the object increases or decreases with a multiplicative rate of change
- quadratic, because the height increases and then decreases
- exponential, because the height of the object increases or decreases with a multiplicative rate of change
- exponential, because the height increases and then decreases
Analyze the trend in the data table
$$
LATEXBLOCK0
$$
The height values increase from \(5\) to \(70\) and then decrease back down to \(4\).
Evaluate the model types and justifications
- Quadratic models represent symmetric parabolic motion (such as projectile motion) where values increase to a maximum and then decrease.
- Exponential models represent continuous growth or decay with a multiplicative rate of change, which do not increase and then decrease.
- Therefore, the data is best represented by a quadratic model because the height increases and then decreases.

Snap & solve any problem in the app
Get step-by-step solutions on Sovi AI
Photo-based solutions with guided steps
Explore more problems and detailed explanations
- quadratic, because the height of the object increases or decreases with a multiplicative rate of change
- quadratic, because the height increases and then decreases (Correct answer)
- exponential, because the height of the object increases or decreases with a multiplicative rate of change
- exponential, because the height increases and then decreases