QUESTION IMAGE
Question
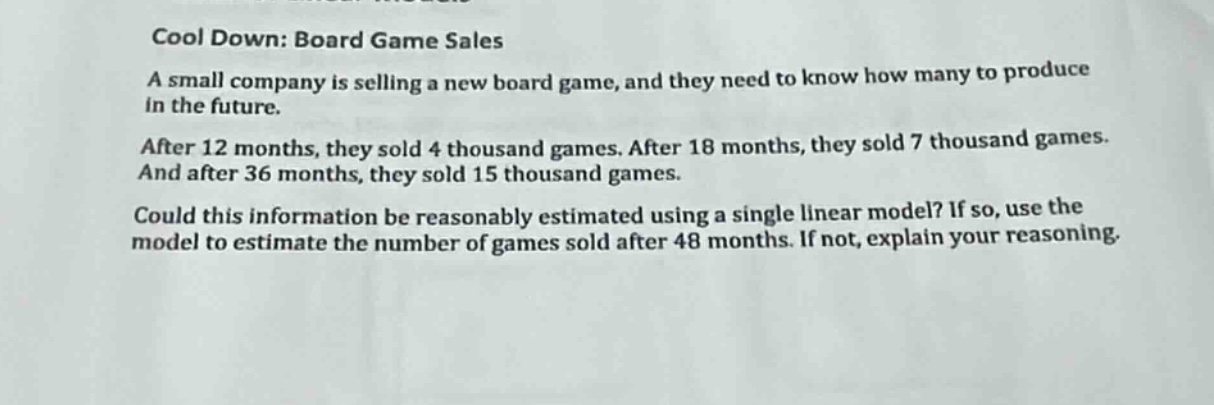
cool down: board game sales
a small company is selling a new board game, and they need to know how many to produce
in the future.
after 12 months, they sold 4 thousand games. after 18 months, they sold 7 thousand games.
and after 36 months, they sold 15 thousand games.
could this information be reasonably estimated using a single linear model? if so, use the
model to estimate the number of games sold after 48 months. if not, explain your reasoning.
Step1: Check linearity between first two points
Let's define the months as \( x \) and sales (in thousands) as \( y \). For the first two points \((12, 4)\) and \((18, 7)\), the slope \( m_1 \) is calculated as \( m_1=\frac{y_2 - y_1}{x_2 - x_1}=\frac{7 - 4}{18 - 12}=\frac{3}{6}=0.5 \). The equation of the line using point - slope form \( y - y_1=m(x - x_1) \) with \((x_1,y_1)=(12,4)\) is \( y - 4 = 0.5(x - 12) \), which simplifies to \( y=0.5x - 6 + 4=0.5x - 2 \).
Step2: Check with the third point
Now, let's check the third point \((36,15)\) in the equation \( y = 0.5x-2 \). Substitute \( x = 36 \) into the equation: \( y=0.5\times36-2=18 - 2 = 16 \). But the actual sales at 36 months is 15 thousand games. The difference between the predicted value (16) and the actual value (15) is 1, which is relatively small? Wait, no, let's recalculate the slope between the first and the third point. The slope between \((12,4)\) and \((36,15)\) is \( m_2=\frac{15 - 4}{36 - 12}=\frac{11}{24}\approx0.458 \), and the slope between \((18,7)\) and \((36,15)\) is \( m_3=\frac{15 - 7}{36 - 18}=\frac{8}{18}=\frac{4}{9}\approx0.444 \). The slopes are not the same. Let's calculate the error for the third point with the line from the first two points. The predicted value at \( x = 36 \) from \( y = 0.5x-2 \) is \( y=0.5\times36 - 2=16 \), and the actual is 15. The residual is \( 15 - 16=- 1 \). Now, let's see the pattern. Let's check the rate of change between 12 - 18 months: from 4 to 7 (an increase of 3 over 6 months, so 0.5 per month). From 18 - 36 months: from 7 to 15 (an increase of 8 over 18 months, which is \( \frac{8}{18}=\frac{4}{9}\approx0.444 \) per month). From 36 - 48 months, if we use the first - two - point slope (0.5), the increase from 36 to 48 is 12 months, so the increase in sales would be \( 0.5\times12 = 6 \), so sales at 48 months would be \( 15+6 = 21 \). But if we use the slope from 18 - 36, the increase per month is \( \frac{4}{9} \), over 12 months, the increase is \( \frac{4}{9}\times12=\frac{16}{3}\approx5.333 \), so sales would be \( 15+\frac{16}{3}=\frac{45 + 16}{3}=\frac{61}{3}\approx20.333 \). However, the difference between the predicted values from different slopes is significant. But let's check the linearity more formally. A linear model has a constant slope. Let's set up the linear equation \( y=mx + b \). Using the first two points \((12,4)\) and \((18,7)\):
We have the system of equations:
\( 4 = 12m + b \)
\( 7=18m + b \)
Subtract the first equation from the second: \( 7 - 4=(18m + b)-(12m + b)\Rightarrow3 = 6m\Rightarrow m = 0.5 \). Then substitute \( m = 0.5 \) into \( 4 = 12\times0.5 + b\Rightarrow4 = 6 + b\Rightarrow b=- 2 \). So the equation is \( y = 0.5x-2 \).
Now, test \( x = 36 \): \( y=0.5\times36-2 = 16 \), but the actual \( y = 15 \). The residual is \( 15 - 16=-1 \). Now, let's see the trend. The first two points give a slope of 0.5, but the third point is 1 less than the predicted value. If we assume that maybe the data has a small error or we can approximate, but let's check the rate of change. Alternatively, maybe the problem expects us to check if the three points are approximately linear. Let's calculate the correlation or the sum of squared residuals. The sum of squared residuals for the three points:
For \((12,4)\): \( (4-(0.5\times12 - 2))^2=(4 - 4)^2 = 0 \)
For \((18,7)\): \( (7-(0.5\times18 - 2))^2=(7 - 7)^2 = 0 \)
For \((36,15)\): \( (15-(0.5\times36 - 2))^2=(15 - 16)^2 = 1 \)
The total sum of squared residuals is 1, which is small. Maybe we can consider it approximately linear.…

Snap & solve any problem in the app
Get step-by-step solutions on Sovi AI
Photo-based solutions with guided steps
Explore more problems and detailed explanations
No, we cannot reasonably estimate using a single linear model. The slope between the first two points (12 months and 18 months) is \( \frac{7 - 4}{18 - 12}=0.5 \) (thousand games per month), and the slope between the second and third points (18 months and 36 months) is \( \frac{15 - 7}{36 - 18}=\frac{4}{9}\approx0.444 \) (thousand games per month). Since the slopes (rate of change of sales with respect to time) are different, the relationship between time and sales is not linear, so a single linear model is not appropriate.