QUESTION IMAGE
Question
chapter 13 review exercises
evaluate the following.
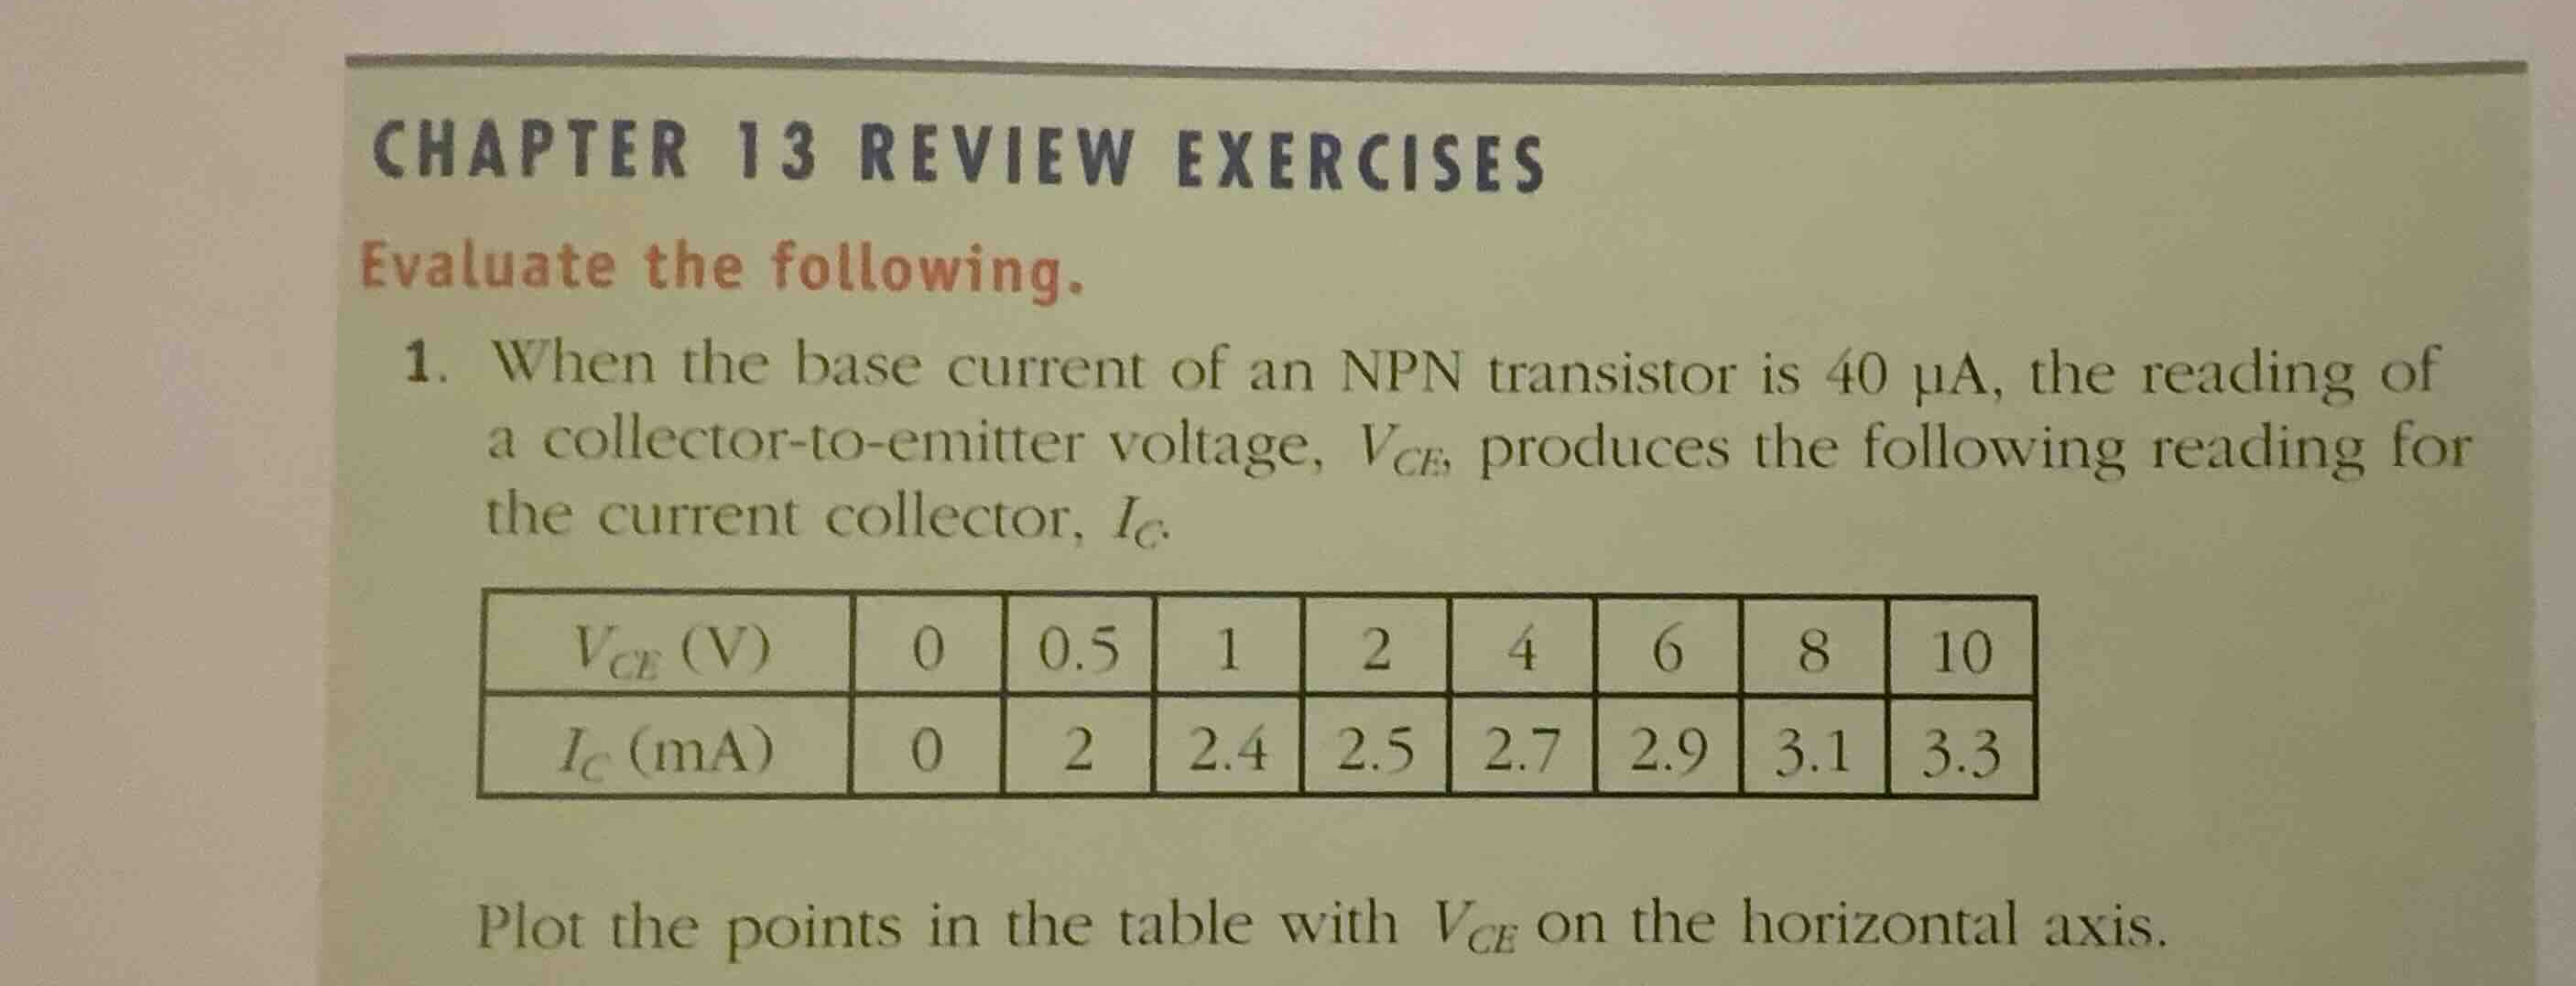
- when the base current of an npn transistor is \\(40\text{ }\mu\text{a}\\), the reading of a collector-to-emitter voltage, \\(v_{ce}\\), produces the following reading for the current collector, \\(i_c\\).
\
plot the points in the table with \\(v_{ce}\\) on the horizontal axis.
Identify the variables and coordinates
The problem asks us to plot the points from the given table.
The horizontal axis is designated for the collector-to-emitter voltage, \(V_{CE}\) in volts (\(\text{V}\)).
The vertical axis is designated for the collector current, \(I_C\) in milliamperes (\(\text{mA}\)).
We can write the data points as ordered pairs \((V_{CE}, I_C)\):
- \((0, 0)\)
- \((0.5, 2)\)
- \((1, 2.4)\)
- \((2, 2.5)\)
- \((4, 2.7)\)
- \((6, 2.9)\)
- \((8, 3.1)\)
- \((10, 3.3)\)
Determine the scale of the axes
To plot these points clearly:
- The horizontal axis (\(V_{CE}\)) ranges from \(0\) to \(10\). A scale with major grid lines every \(1\) or \(2\) units is appropriate.
- The vertical axis (\(I_C\)) ranges from \(0\) to \(3.3\). A scale with major grid lines every \(0.5\) or \(1\) unit is appropriate.
Plot each ordered pair
We locate each coordinate pair on our coordinate system:
- Start at the origin \((0,0)\).
- For \((0.5, 2)\), move \(0.5\) units right and \(2\) units up.
- For \((1, 2.4)\), move \(1\) unit right and \(2.4\) units up.
- For \((2, 2.5)\), move \(2\) units right and \(2.5\) units up.
- For \((4, 2.7)\), move \(4\) units right and \(2.7\) units up.
- For \((6, 2.9)\), move \(6\) units right and \(2.9\) units up.
- For \((8, 3.1)\), move \(8\) units right and \(3.1\) units up.
- For \((10, 3.3)\), move \(10\) units right and \(3.3\) units up.
Connect the plotted points
In transistor characteristic curves, the points are typically connected with a smooth curve to represent the continuous physical relationship between \(V_{CE}\) and \(I_C\) at a constant base current (\(I_B = 40\ \mu\text{A}\)).

Snap & solve any problem in the app
Get step-by-step solutions on Sovi AI
Photo-based solutions with guided steps
Explore more problems and detailed explanations
To plot the given data, we represent each column in the table as an ordered pair \((V_{CE}, I_C)\), where the horizontal axis represents \(V_{CE}\) (in \(\text{V}\)) and the vertical axis represents \(I_C\) (in \(\text{mA}\)).
The coordinates to plot are:
- \((0, 0)\)
- \((0.5, 2.0)\)
- \((1.0, 2.4)\)
- \((2.0, 2.5)\)
- \((4.0, 2.7)\)
- \((6.0, 2.9)\)
- \((8.0, 3.1)\)
- \((10.0, 3.3)\)