QUESTION IMAGE
Question
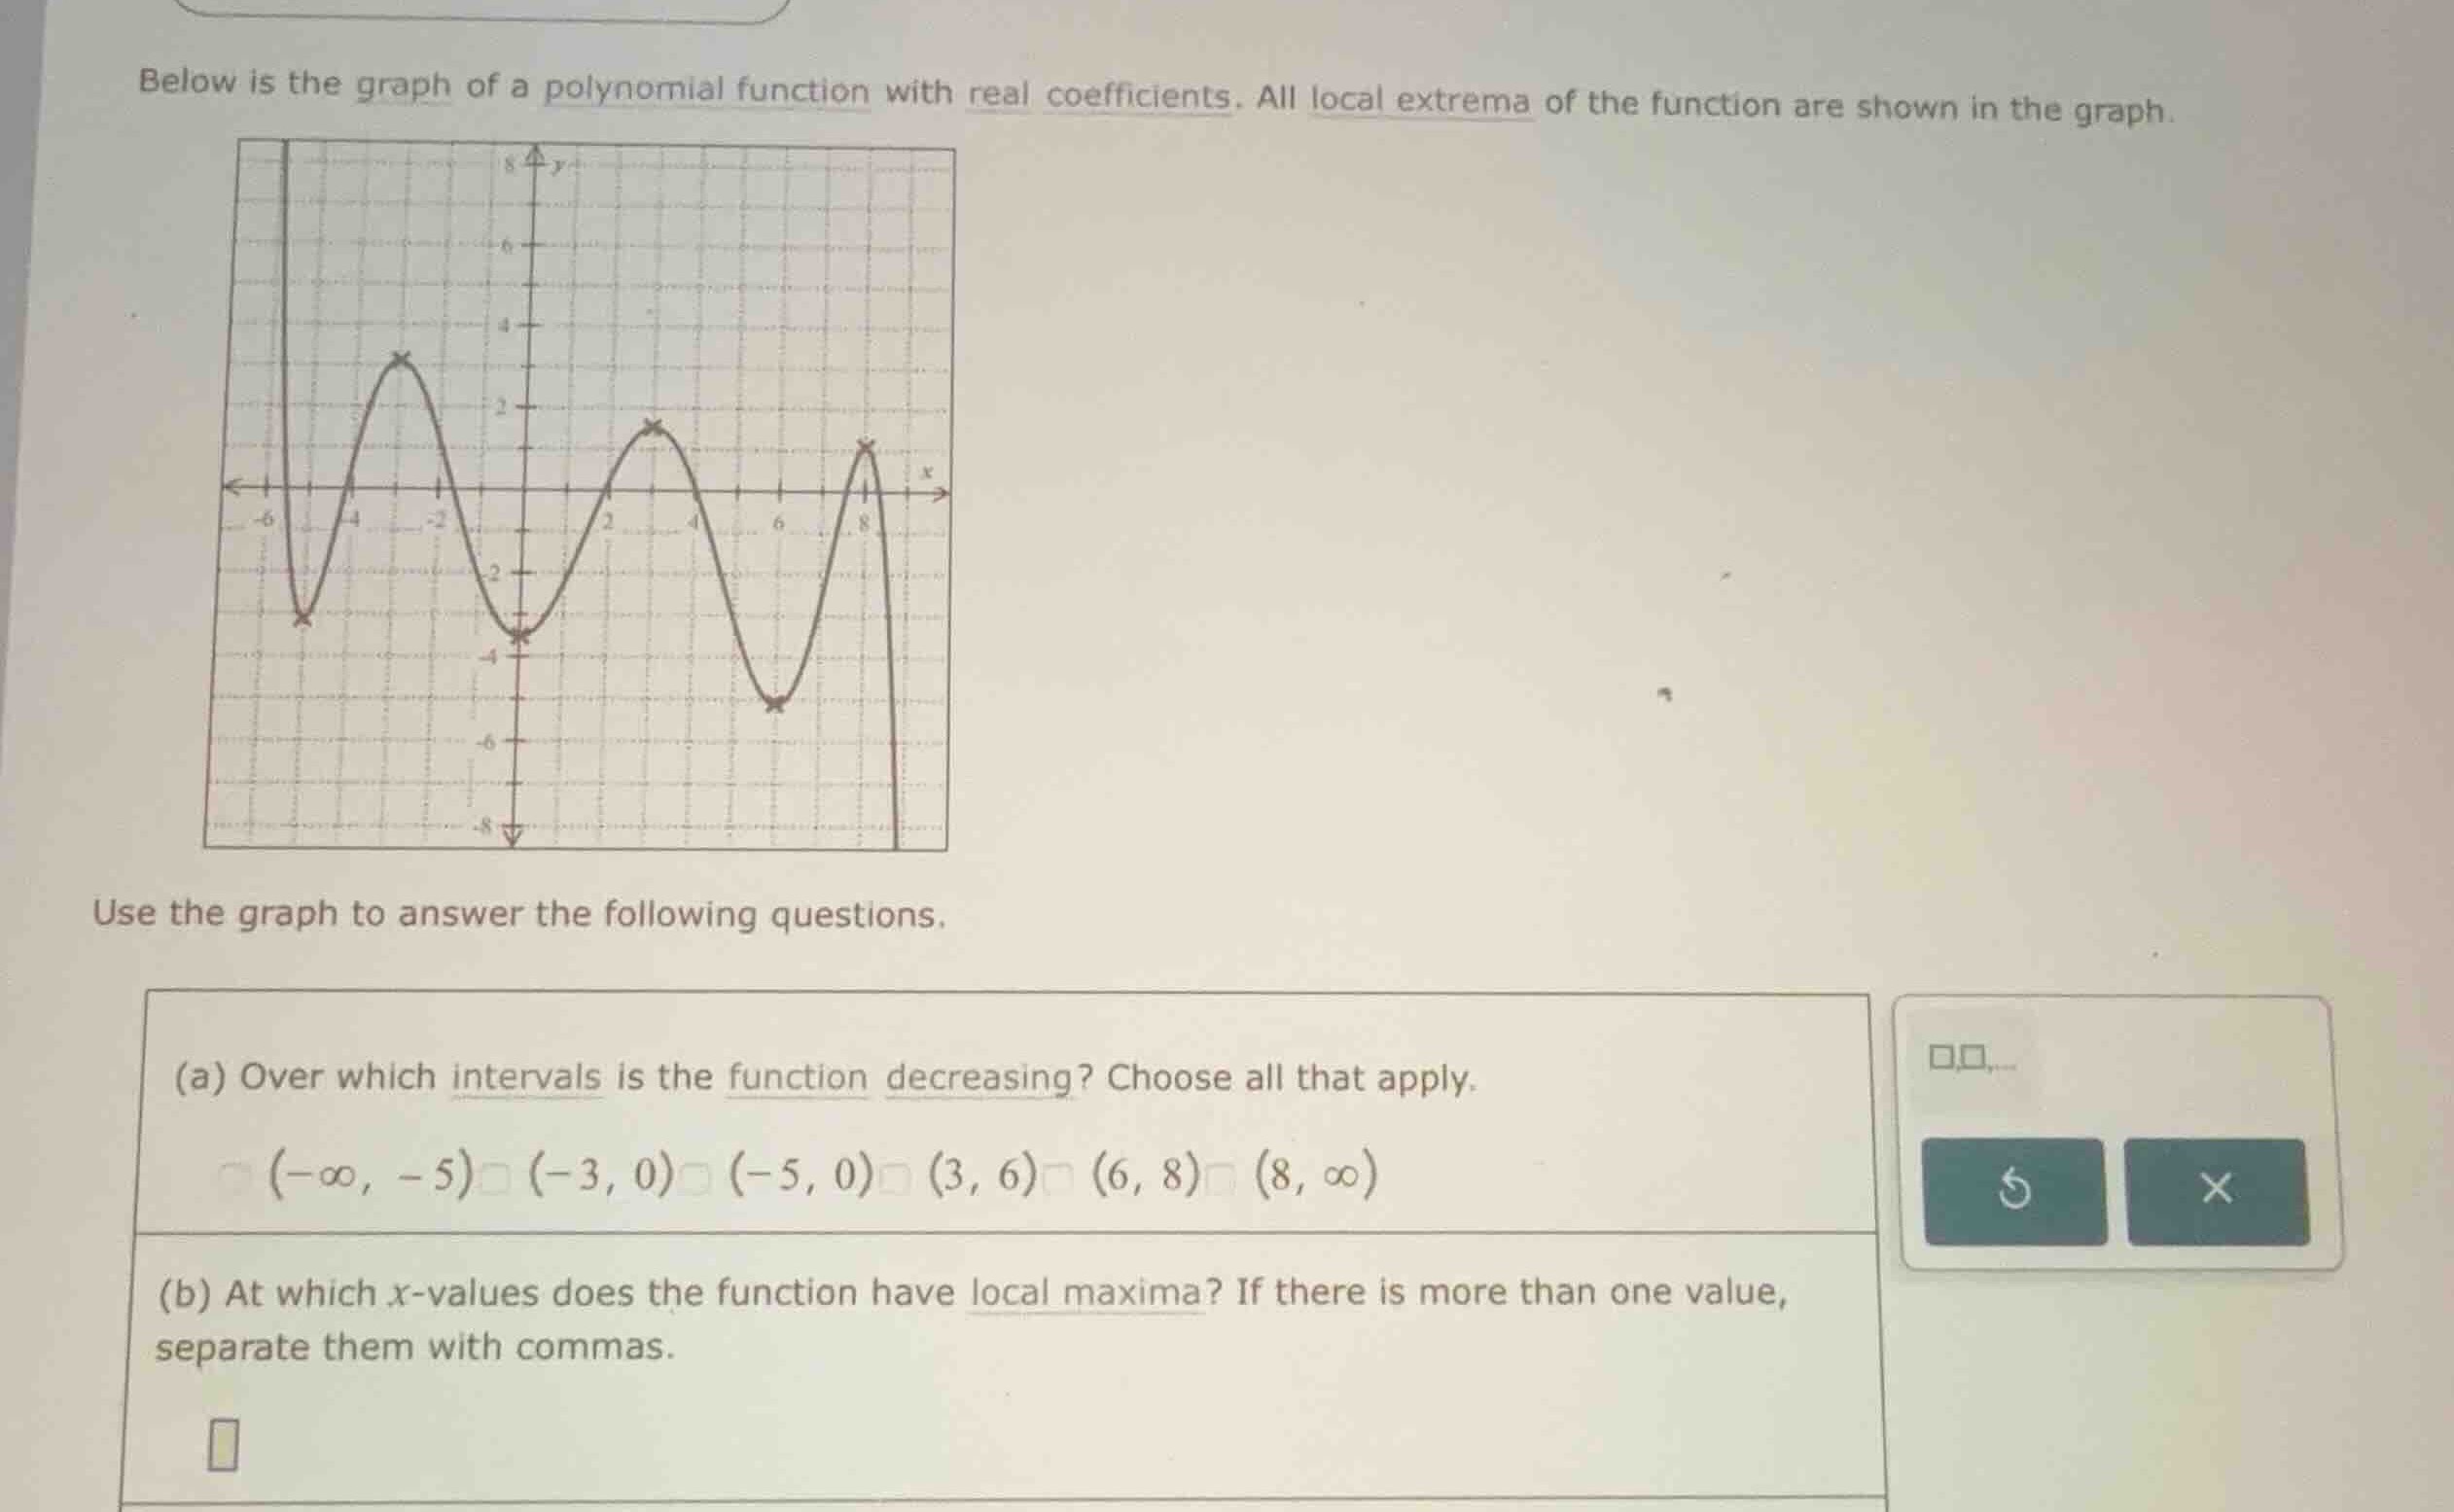
below is the graph of a polynomial function with real coefficients. all local extrema of the function are shown in the graph.
use the graph to answer the following questions.
(a) over which intervals is the function decreasing? choose all that apply.
\\((-\infty, -5)\\) \\((-3, 0)\\) \\((-5, 0)\\) \\((3, 6)\\) \\((6, 8)\\) \\((8, \infty)\\)
(b) at which \\(x\\)-values does the function have local maxima? if there is more than one value, separate them with commas.
Identify decreasing intervals from local extrema
Identify x-values of local maxima

Snap & solve any problem in the app
Get step-by-step solutions on Sovi AI
Photo-based solutions with guided steps
Explore more problems and detailed explanations
Question (a)
Over which intervals is the function decreasing? Choose all that apply.
- [x] \((-\infty, -5)\)
- [x] \((-3, 0)\)
- [ ] \((-5, 0)\)
- [x] \((3, 6)\)
- [ ] \((6, 8)\)
- [x] \((8, \infty)\)
Question (b)
At which \(x\)-values does the function have local maxima? If there is more than one value, separate them with commas.
<blank>-3, 3, 8</blank>