QUESTION IMAGE
Question
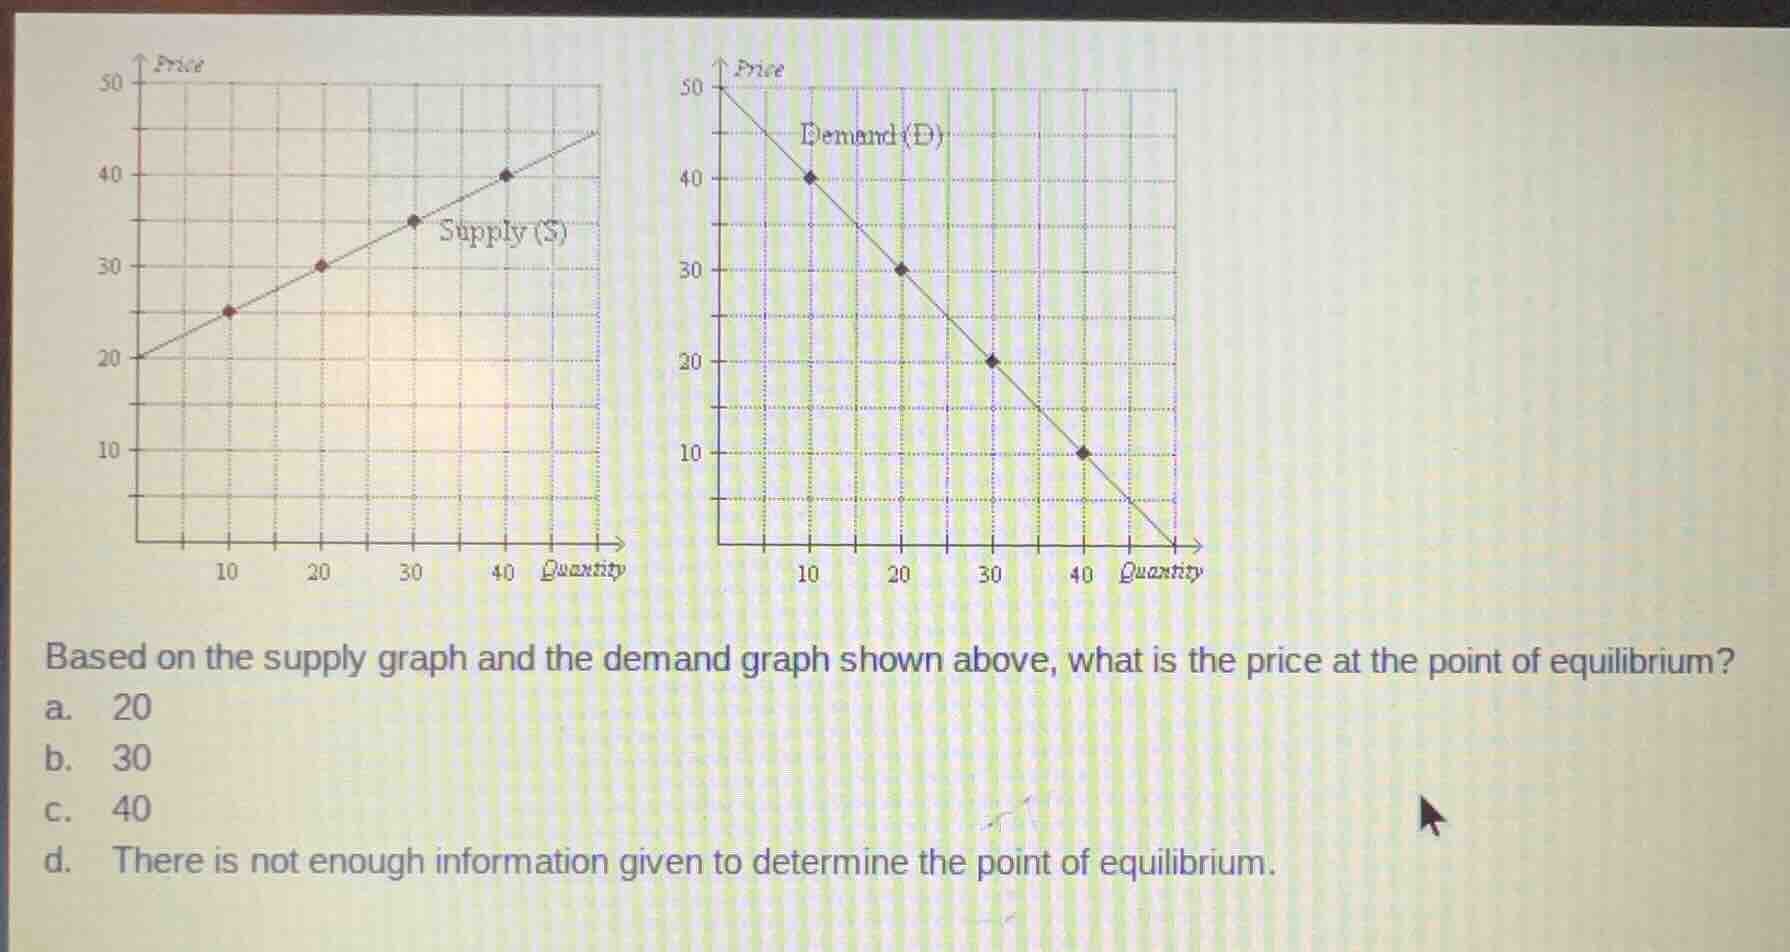
based on the supply graph and the demand graph shown above, what is the price at the point of equilibrium?
a. 20
b. 30
c. 40
d. there is not enough information given to determine the point of equilibrium.
Determine the supply equation
Using the Supply Curve Analysis knowledge point
$$
LATEXBLOCK0
$$
Determine the demand equation
Using the Demand Curve Analysis knowledge point
$$
LATEXBLOCK1
$$
Find the equilibrium point
Using the Market Equilibrium knowledge point
$$
LATEXBLOCK2
$$

Snap & solve any problem in the app
Get step-by-step solutions on Sovi AI
Photo-based solutions with guided steps
Explore more problems and detailed explanations
- a. 20
- b. 30 (Correct answer)
- c. 40
- d. There is not enough information given to determine the point of equilibrium.