QUESTION IMAGE
Question
\\\
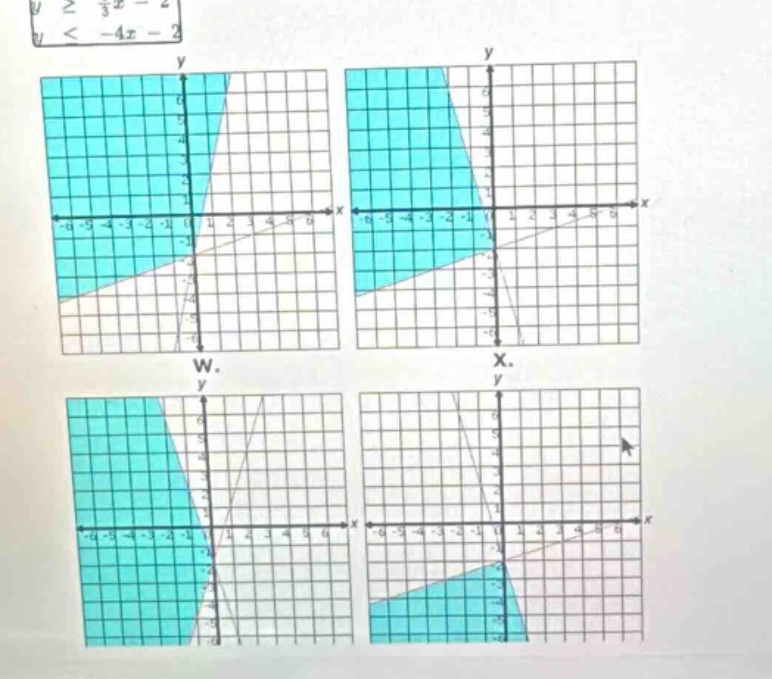
$$\begin{cases} y \\ge \\frac{1}{3}x - 2 \\\\ y < -4x - 2 \\end{cases}$$
\\
which graph represents the system of inequalities?
w.
x.
y.
z.
🆕 New Concept Discovered: Graphing Systems of Linear Inequalities
Shading overlapping regions of boundary lines
Step 1: Identify the inequalities
The system of inequalities shown at the top of the image is:
$$
LATEXBLOCK0
$$
Step 2: Analyze the boundary lines and shading
For the first inequality, \( y \ge \frac{1}{3}x - 2 \):
- The boundary line is solid because of the "\(\ge\)" symbol.
- The line has a \(y\)-intercept at \((0, -2)\) and a positive slope of \(\frac{1}{3}\).
- The shading is above this solid line because of the "\(\ge\)" symbol.
For the second inequality, \( y < -4x - 2 \):
- The boundary line is dashed because of the "\(<\)" symbol.
- The line has a \(y\)-intercept at \((0, -2)\) and a steep negative slope of \(-4\).
- The shading is below (to the left of) this dashed line because of the "\(<\)" symbol.
Step 3: Find the overlapping region
We need to find the graph where the shaded region is simultaneously above the solid line \( y = \frac{1}{3}x - 2 \) and below/left of the dashed line \( y = -4x - 2 \):
- Graph W: The shaded region is above the solid line and to the right of the dashed line.
- Graph X: The shaded region is above the solid line and to the left of the dashed line. This matches both of our conditions.
- Graph Y: The shaded region is below the solid line.
- Graph Z: The shaded region is below the solid line.
Therefore, Graph X represents the correct solution set.

Snap & solve any problem in the app
Get step-by-step solutions on Sovi AI
Photo-based solutions with guided steps
Explore more problems and detailed explanations
X