QUESTION IMAGE
Question
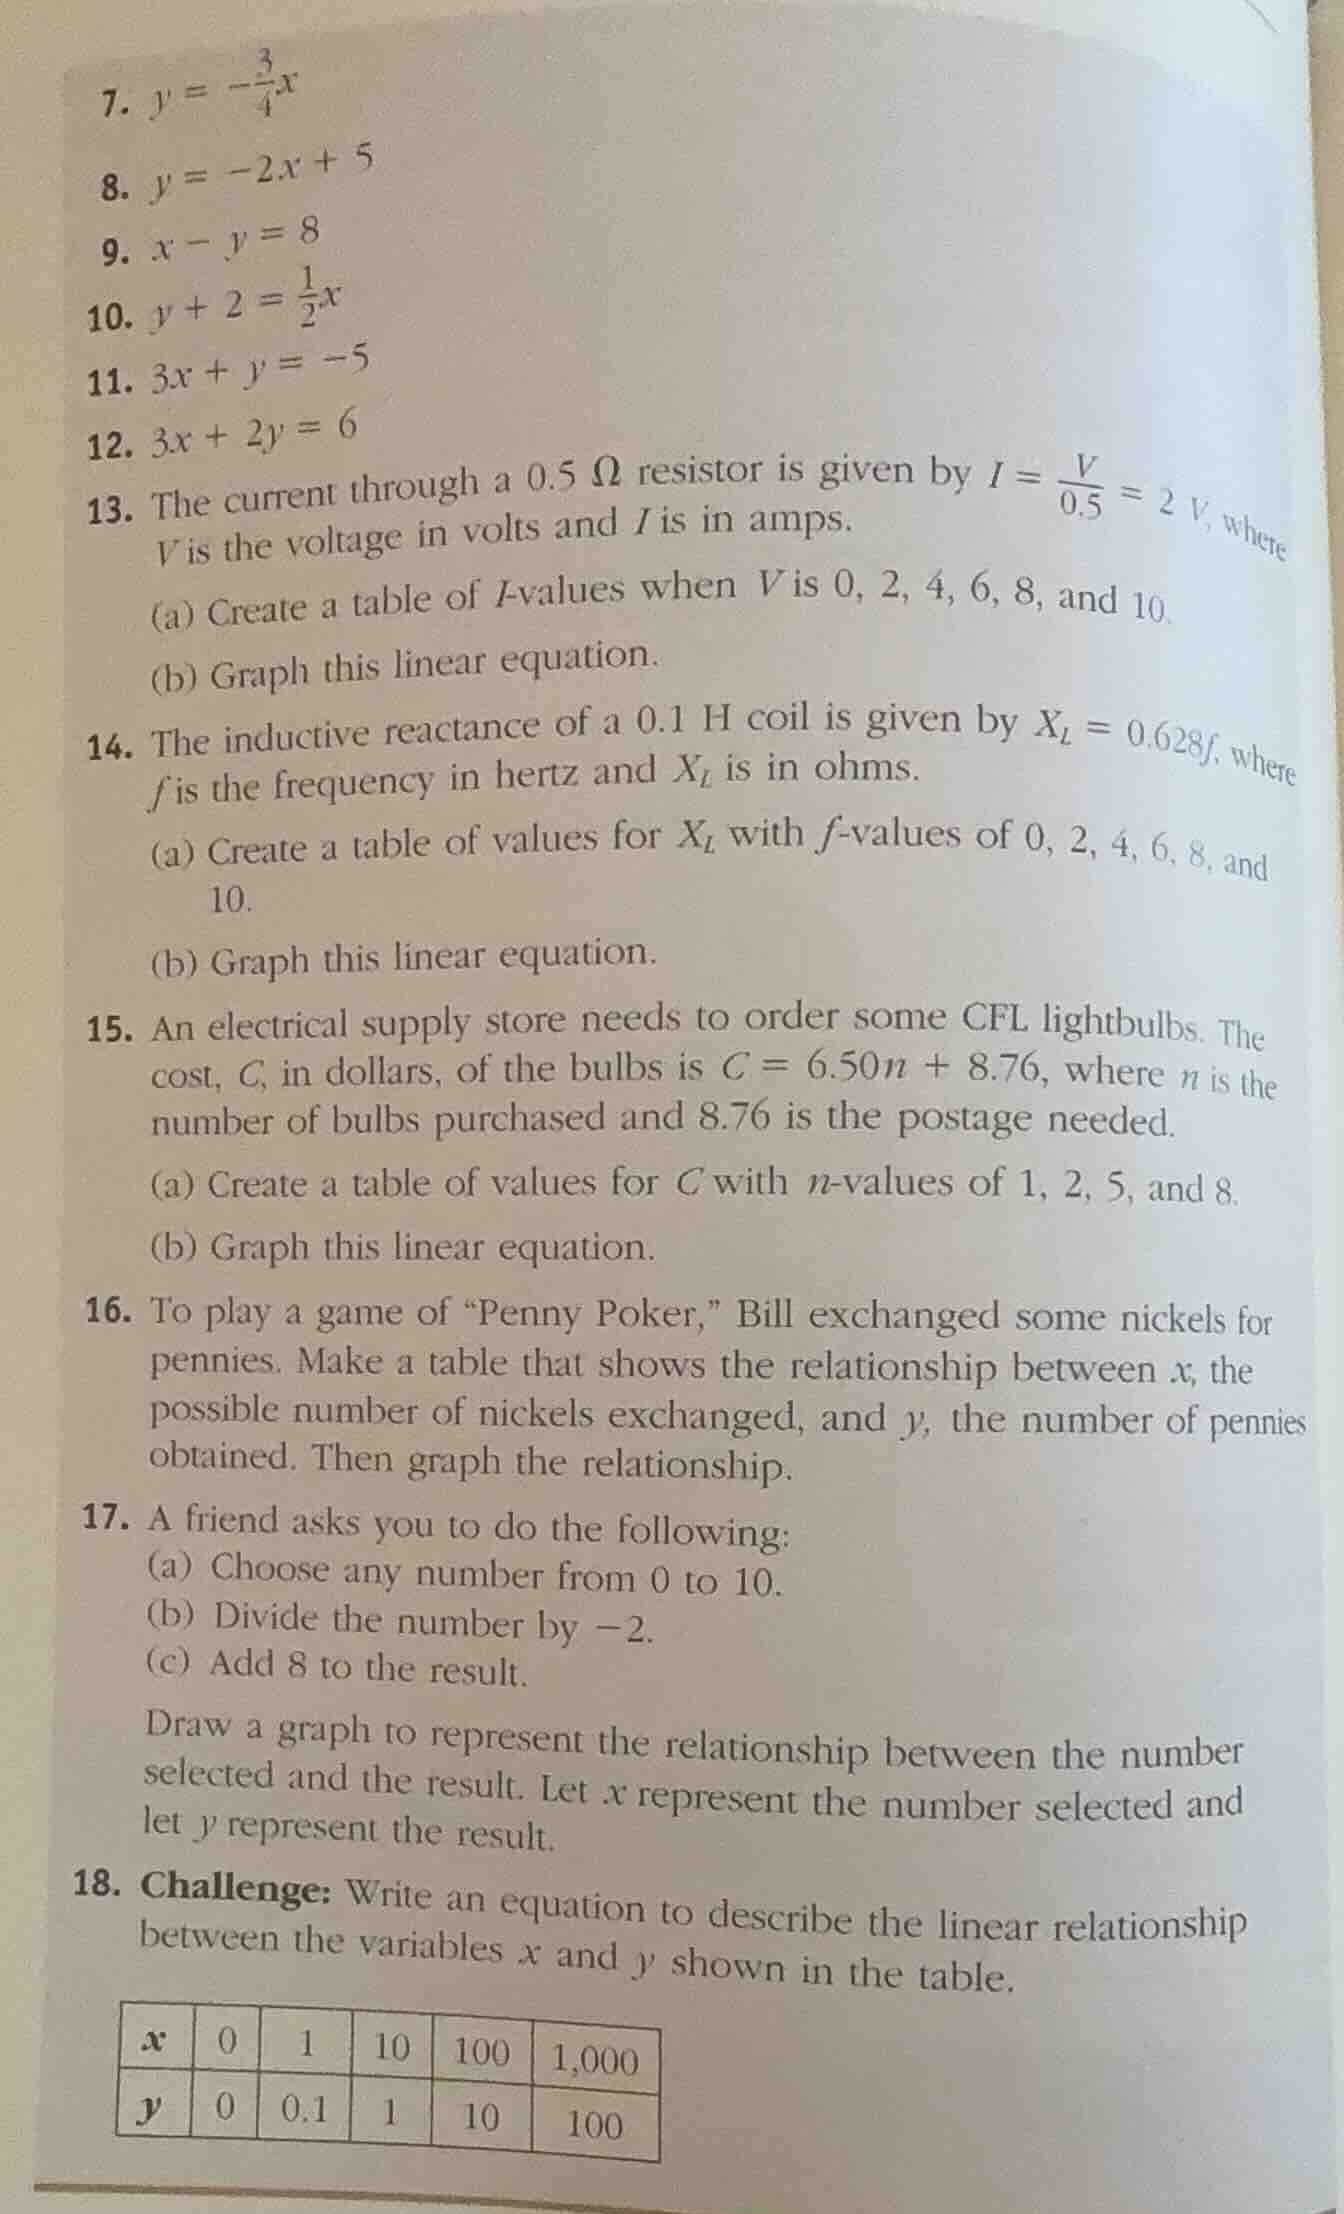
- (y = -\frac{3}{4}x)
- (y = -2x + 5)
- (x - y = 8)
- (y + 2 = \frac{1}{2}x)
- (3x + y = -5)
- (3x + 2y = 6)
- the current through a (0.5 omega) resistor is given by (i = \frac{v}{0.5} = 2v), where (v) is the voltage in volts and (i) is in amps.
(a) create a table of (i)-values when (v) is (0, 2, 4, 6, 8,) and (10).
(b) graph this linear equation.
- the inductive reactance of a (0.1\text{ h}) coil is given by (x_l = 0.628f), where (f) is the frequency in hertz and (x_l) is in ohms.
(a) create a table of values for (x_l) with (f)-values of (0, 2, 4, 6, 8,) and (10).
(b) graph this linear equation.
- an electrical supply store needs to order some cfl lightbulbs. the cost, (c), in dollars, of the bulbs is (c = 6.50n + 8.76), where (n) is the number of bulbs purchased and (8.76) is the postage needed.
(a) create a table of values for (c) with (n)-values of (1, 2, 5,) and (8).
(b) graph this linear equation.
- to play a game of \penny poker,\ bill exchanged some nickels for pennies. make a table that shows the relationship between (x), the possible number of nickels exchanged, and (y), the number of pennies obtained. then graph the relationship.
- a friend asks you to do the following:
(a) choose any number from (0) to (10).
(b) divide the number by (-2).
(c) add (8) to the result.
draw a graph to represent the relationship between the number selected and the result. let (x) represent the number selected and let (y) represent the result.
- challenge: write an equation to describe the linear relationship between the variables (x) and (y) shown in the table.
\
Formulate the linear relationship
Generate the table of values
Identify key points for graphing

Snap & solve any problem in the app
Get step-by-step solutions on Sovi AI
Photo-based solutions with guided steps
Explore more problems and detailed explanations
The relationship between the number of nickels exchanged, \(x\), and the number of pennies obtained, \(y\), is given by the linear equation:
Table of Values
| \(x\) (Nickels) | \(y\) (Pennies) |
|---|---|
| 1 | 5 |
| 2 | 10 |
| 3 | 15 |
| 4 | 20 |