QUESTION IMAGE
Question
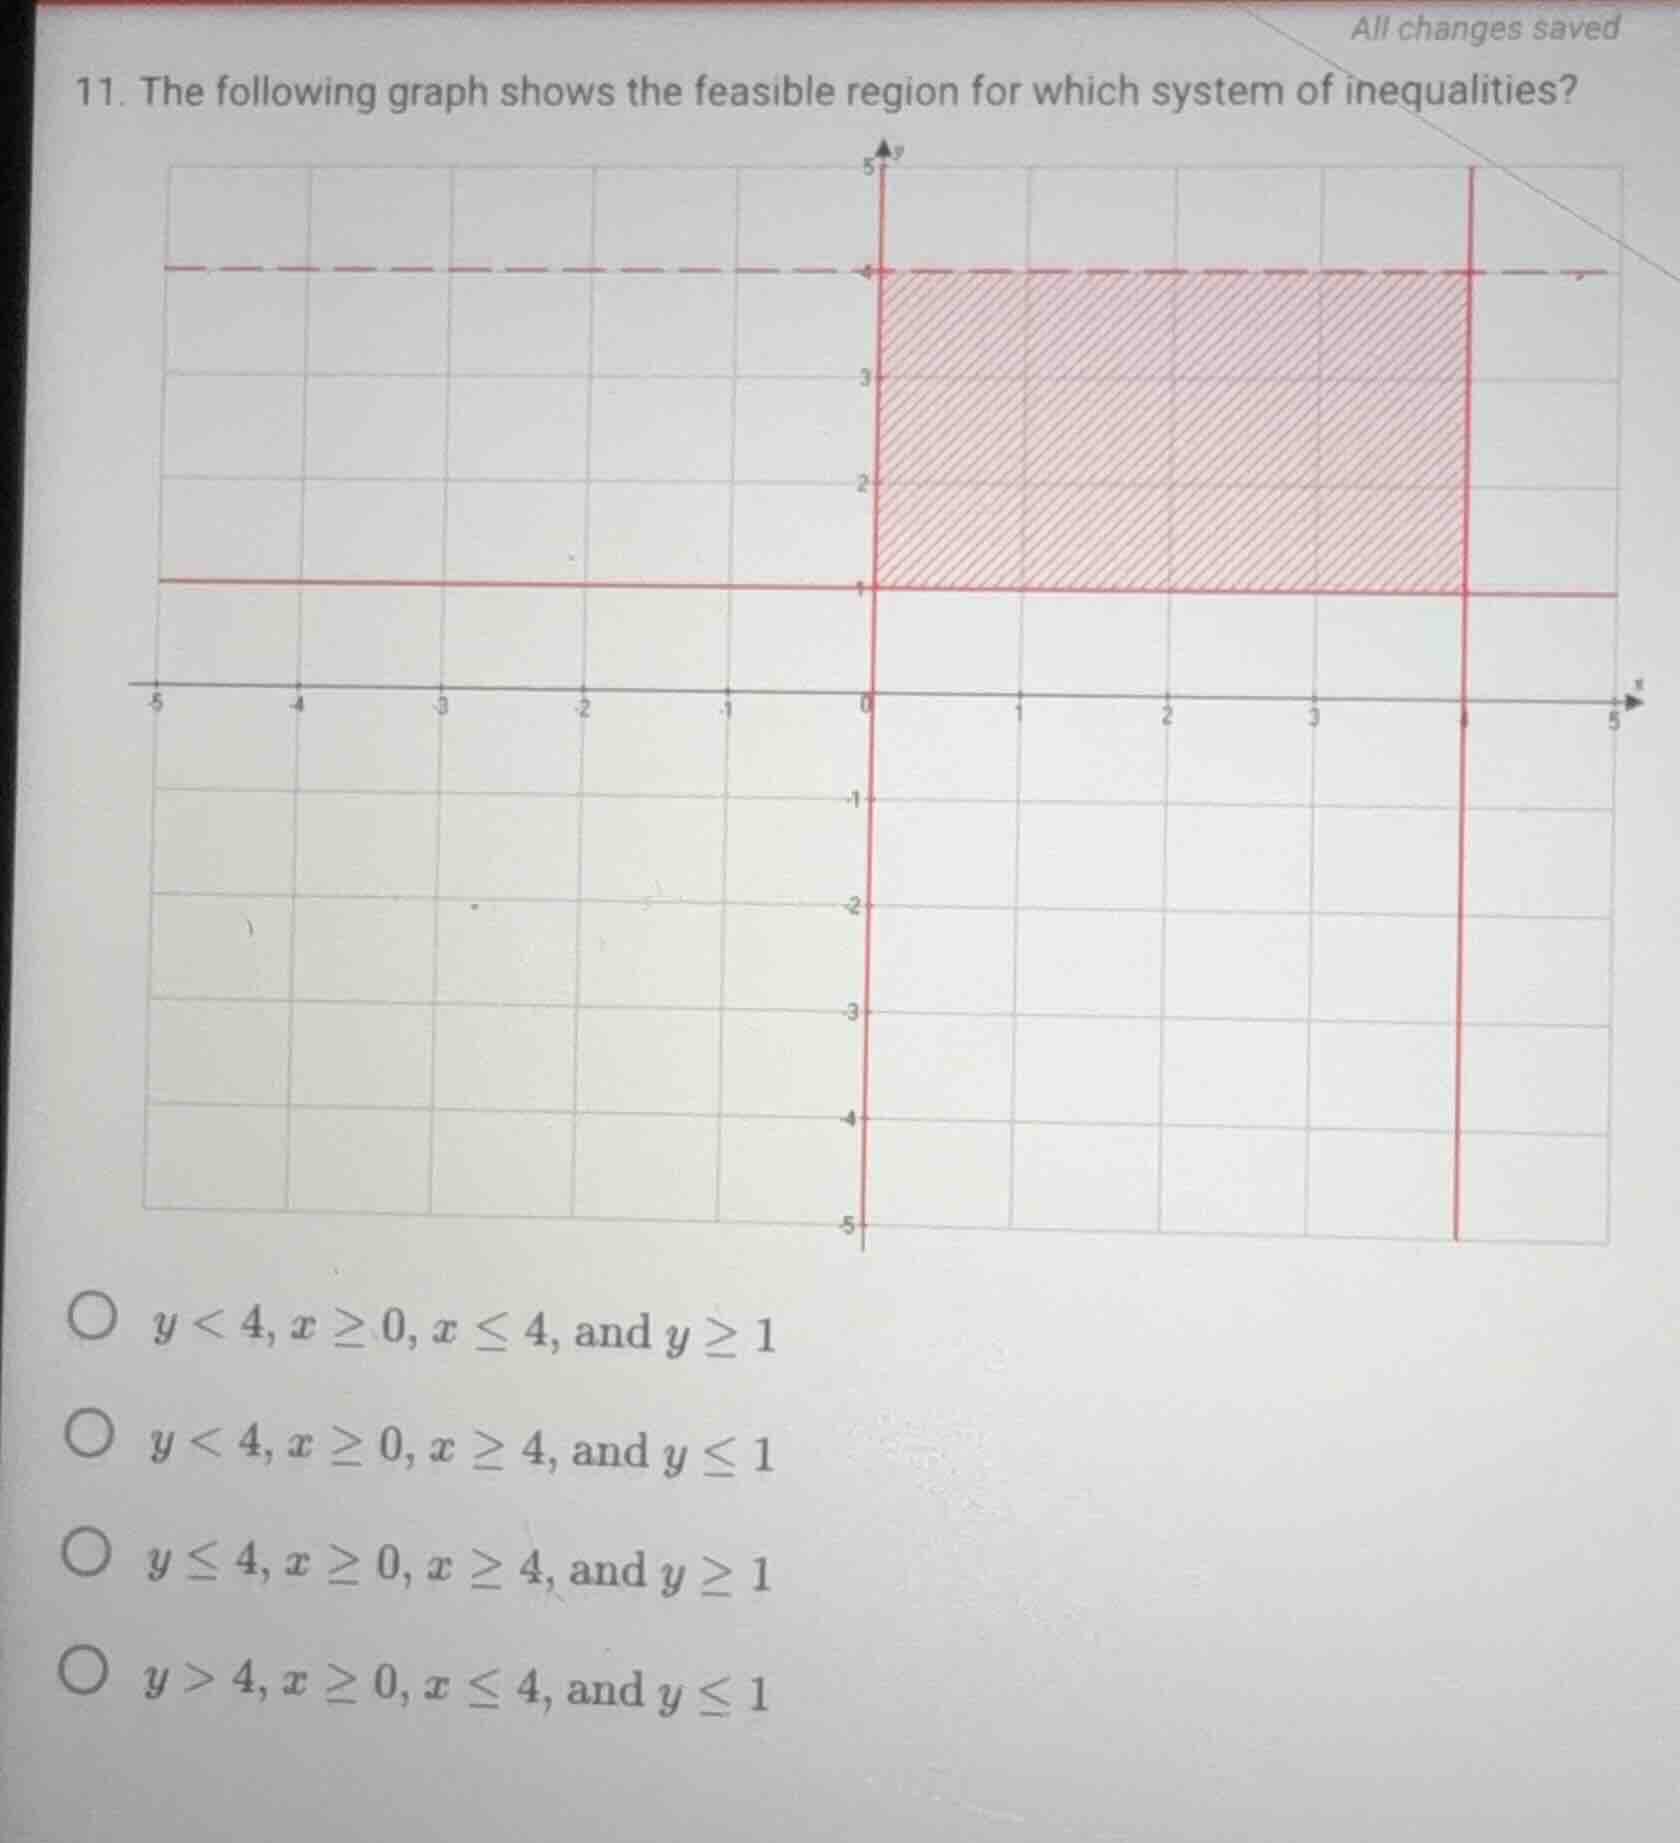
- the following graph shows the feasible region for which system of inequalities?
options:
- $y < 4, x \geq 0, x \leq 4$, and $y \geq 1$
- $y < 4, x \geq 0, x \geq 4$, and $y \leq 1$
- $y \leq 4, x \geq 0, x \geq 4$, and $y \geq 1$
- $y > 4, x \geq 0, x \leq 4$, and $y \leq 1$
Step1: Analyze vertical boundaries
The feasible region is between $x=0$ (solid line, $x\geq0$) and $x=4$ (solid line, $x\leq4$).
Step2: Analyze horizontal boundaries
The feasible region is between $y=1$ (solid line, $y\geq1$) and $y=4$ (dashed line, $y<4$).
Step3: Match to options
Combine the inequalities to match the correct system.

Snap & solve any problem in the app
Get step-by-step solutions on Sovi AI
Photo-based solutions with guided steps
Explore more problems and detailed explanations
$y < 4, x \geq 0, x \leq 4$, and $y \geq 1$