QUESTION IMAGE
Question
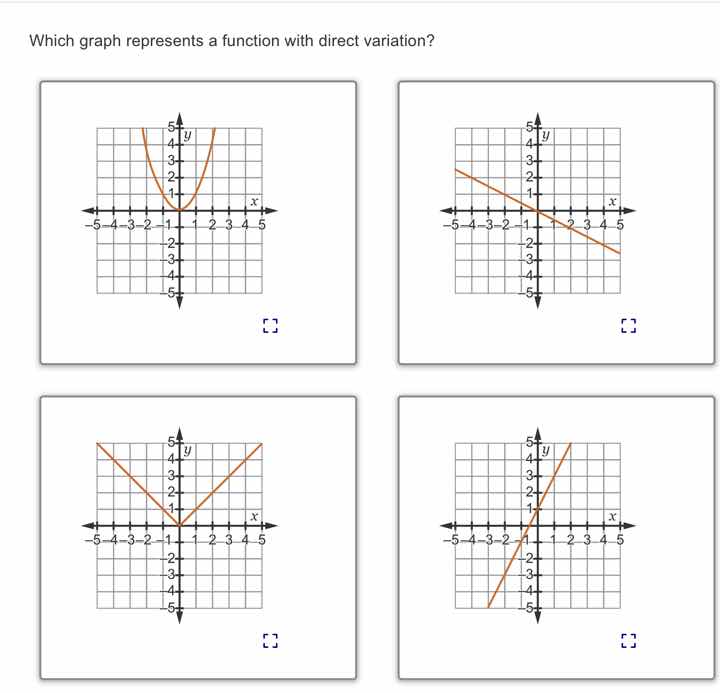
which graph represents a function with direct variation?
Step1: Recall Direct Variation Definition
A direct variation function has the form \( y = kx \), where \( k \) is a constant. Its graph is a straight line passing through the origin \((0,0)\) (since when \( x = 0 \), \( y = 0 \)).
Step2: Analyze Each Graph
- First Graph: A parabola (quadratic function, \( y = ax^2 \)), not a straight line through origin. Eliminate.
- Second Graph: A straight line, but it does not pass through \((0,0)\) (y-intercept is 1). Eliminate.
- Third Graph: A V - shaped graph (absolute value function, \( y = |x| + c \)), y - intercept is 1 (not 0). Eliminate.
- Fourth Graph: A straight line passing through the origin \((0,0)\), which fits \( y = kx \) (direct variation) form.

Snap & solve any problem in the app
Get step-by-step solutions on Sovi AI
Photo-based solutions with guided steps
Explore more problems and detailed explanations
The graph in the bottom - right (the fourth graph) represents a function with direct variation.