QUESTION IMAGE
Question
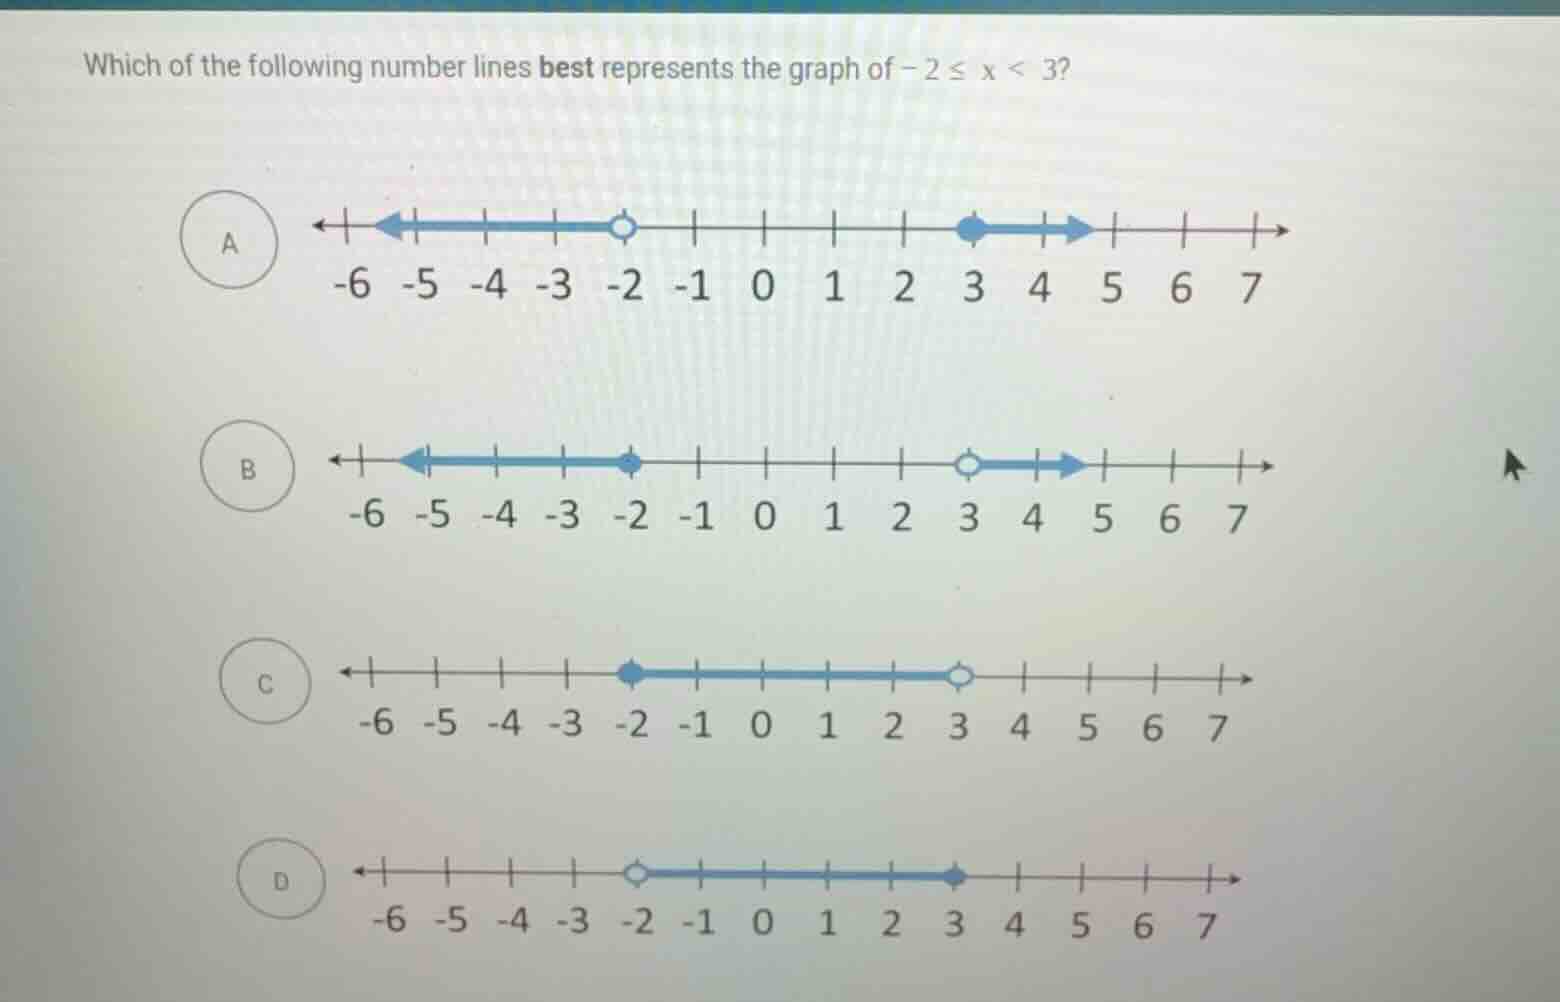
which of the following number lines best represents the graph of \\(-2 \le x < 3\\)?
Analyze the inequality boundaries
$$
-2 \le x < 3
$$
Determine circle types for boundaries
$$
LATEXBLOCK0
$$
Match with the given options
$$
LATEXBLOCK1
$$

Snap & solve any problem in the app
Get step-by-step solutions on Sovi AI
Photo-based solutions with guided steps
Explore more problems and detailed explanations
- (A) Open circle at -2, solid circle at 3, shaded outwards
- (B) Solid circle at -2, open circle at 3, shaded outwards
- (C) Solid circle at -2, open circle at 3, shaded between (Correct answer)
- (D) Open circle at -2, solid circle at 3, shaded between