QUESTION IMAGE
Question
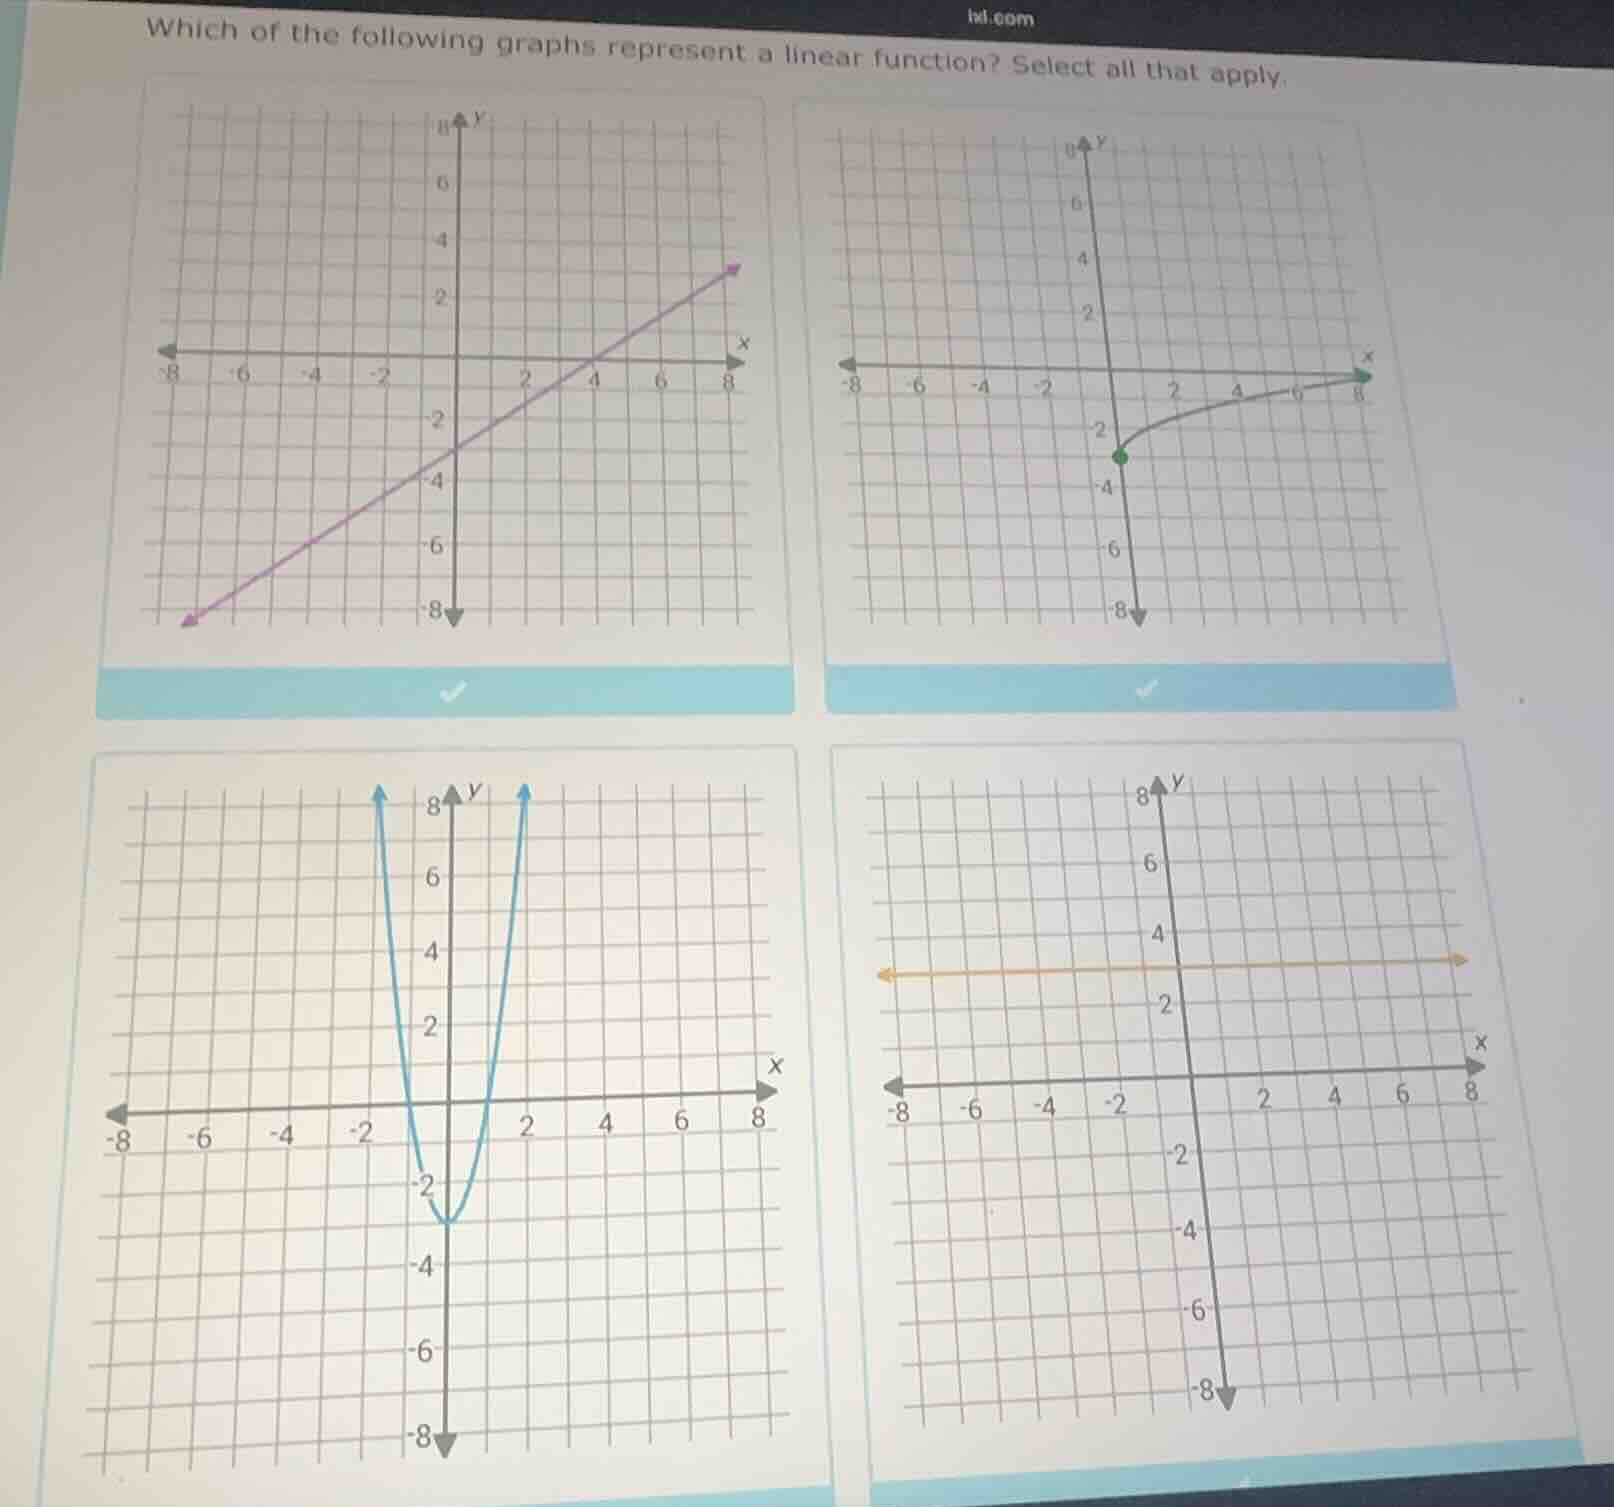
which of the following graphs represent a linear function? select all that apply.
Step1: Recall linear function graph
A linear function has the form \( y = mx + b \), and its graph is a straight line (non - curved, constant slope).
Step2: Analyze each graph
- First graph (purple line): It is a straight line, so it represents a linear function.
- Second graph (green curve): It is a curved line, so it does not represent a linear function (it is a non - linear curve, likely a square - root or some other non - linear relation).
- Third graph (blue parabola): It is a parabola (the graph of a quadratic function \( y=ax^{2}+bx + c \)), which is a curved line, so it does not represent a linear function.
- Fourth graph (orange line): It is a horizontal straight line (which can be written as \( y = k\) where \(k\) is a constant, and in the form of \(y=mx + b\), \(m = 0\) and \(b=k\)), so it represents a linear function.

Snap & solve any problem in the app
Get step-by-step solutions on Sovi AI
Photo-based solutions with guided steps
Explore more problems and detailed explanations
The first graph (purple straight line) and the fourth graph (orange horizontal straight line) represent linear functions.