QUESTION IMAGE
Question
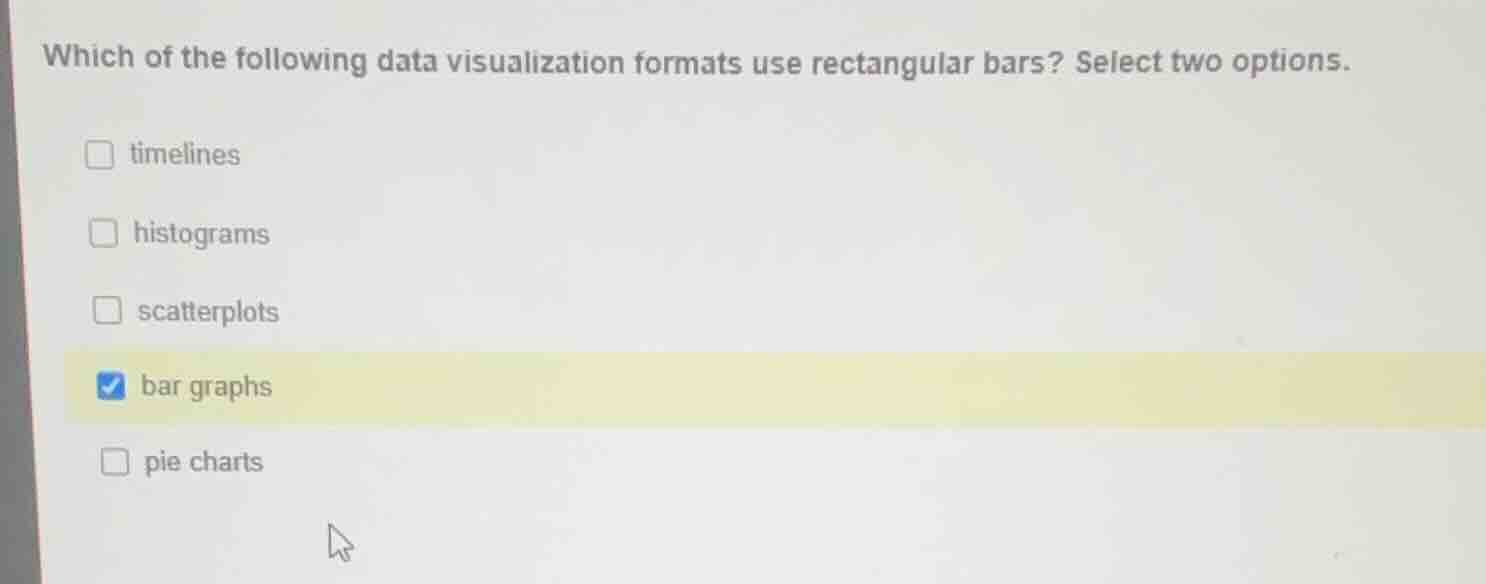
which of the following data visualization formats use rectangular bars? select two options.
timelines
histograms
scatterplots
bar graphs
pie charts
Identify the visual elements of each format
Using the Data Visualization knowledge point:
- Timelines represent events chronologically, typically using lines, points, or blocks.
- Histograms display continuous data distributions using adjacent rectangular bars.
- Scatterplots use individual data points plotted on a coordinate grid.
- Bar graphs represent categorical data using separate rectangular bars.
- Pie charts represent numerical proportions using circular sectors.
Select the formats using rectangular bars
Using the Scatterplot Definition and Data Visualization knowledge points:
- Histograms and bar graphs both rely on rectangular bars to represent values.
- Scatterplots use points, not bars.
- Therefore, the two correct options are histograms and bar graphs.

Snap & solve any problem in the app
Get step-by-step solutions on Sovi AI
Photo-based solutions with guided steps
Explore more problems and detailed explanations
- timelines
- histograms (Correct answer)
- scatterplots
- bar graphs (Correct answer)
- pie charts