QUESTION IMAGE
Question
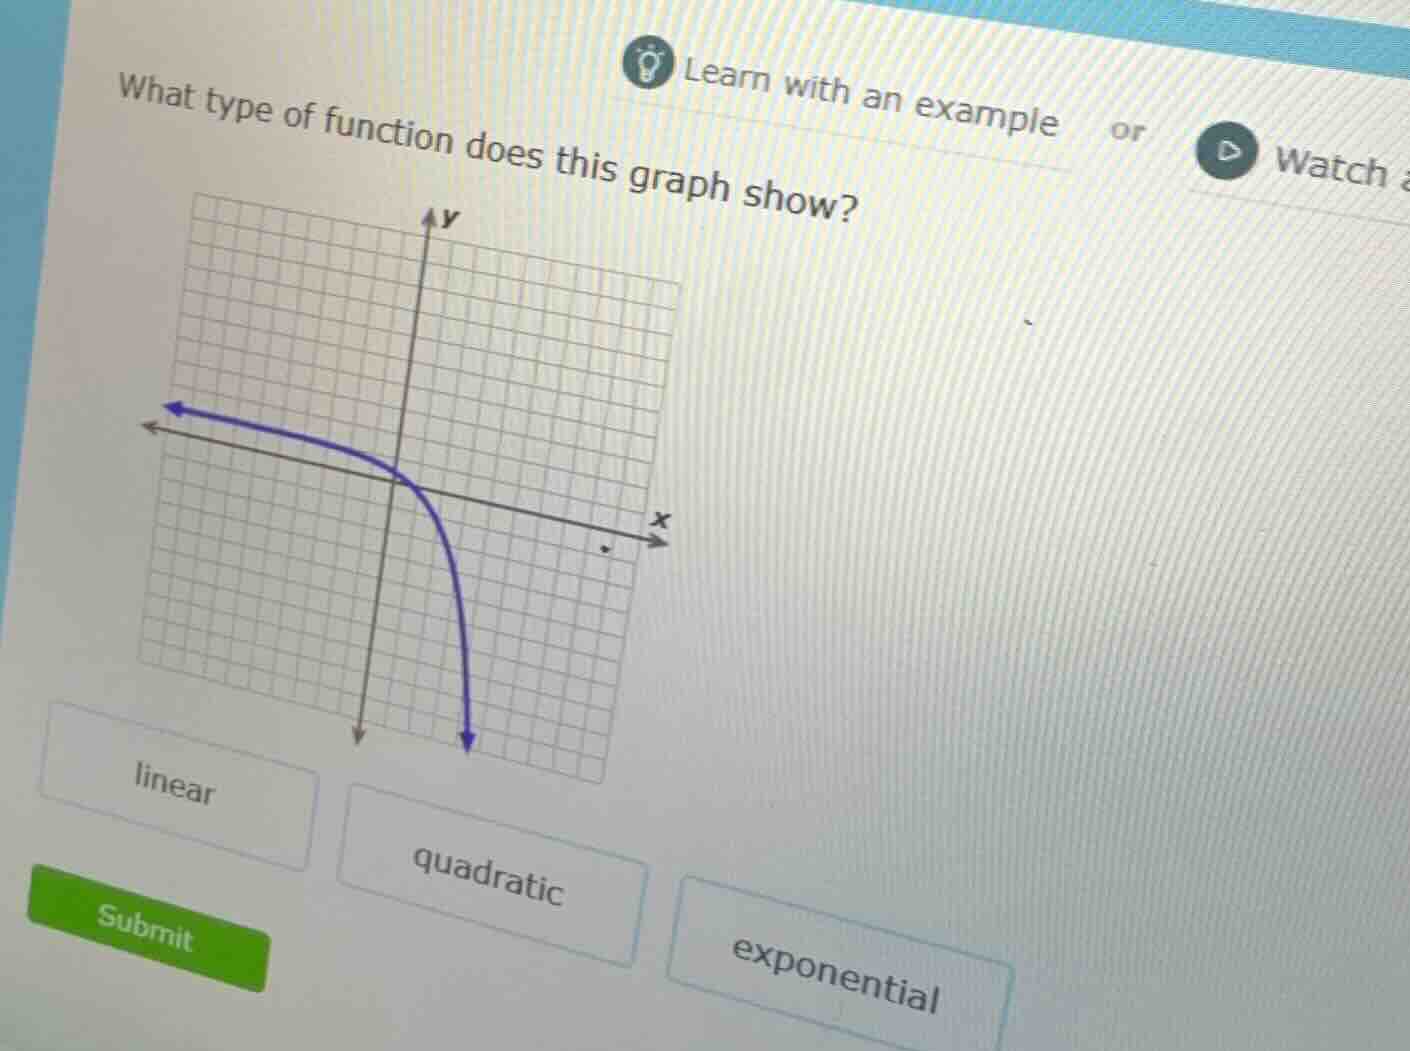
what type of function does this graph show?
linear
quadratic
exponential
Analyze the shape of the graphed curve
$$
\text{The graph shows a curve that approaches a horizontal asymptote as } x \to -\infty \text{ and decreases rapidly as } x \to \infty.
$$
Compare with standard function behaviors
$$
LATEXBLOCK0
$$
Determine the correct function type
$$
\text{The graph represents an exponential decay function of the form } y = -a \cdot b^x + c \text{ or similar exponential variation.}
$$

Snap & solve any problem in the app
Get step-by-step solutions on Sovi AI
Photo-based solutions with guided steps
Explore more problems and detailed explanations
- linear
- quadratic
- exponential (Correct answer)