QUESTION IMAGE
Question
using science skills
use the diagram to answer each question. write the answers on a separate sheet of paper.
figure 1-2
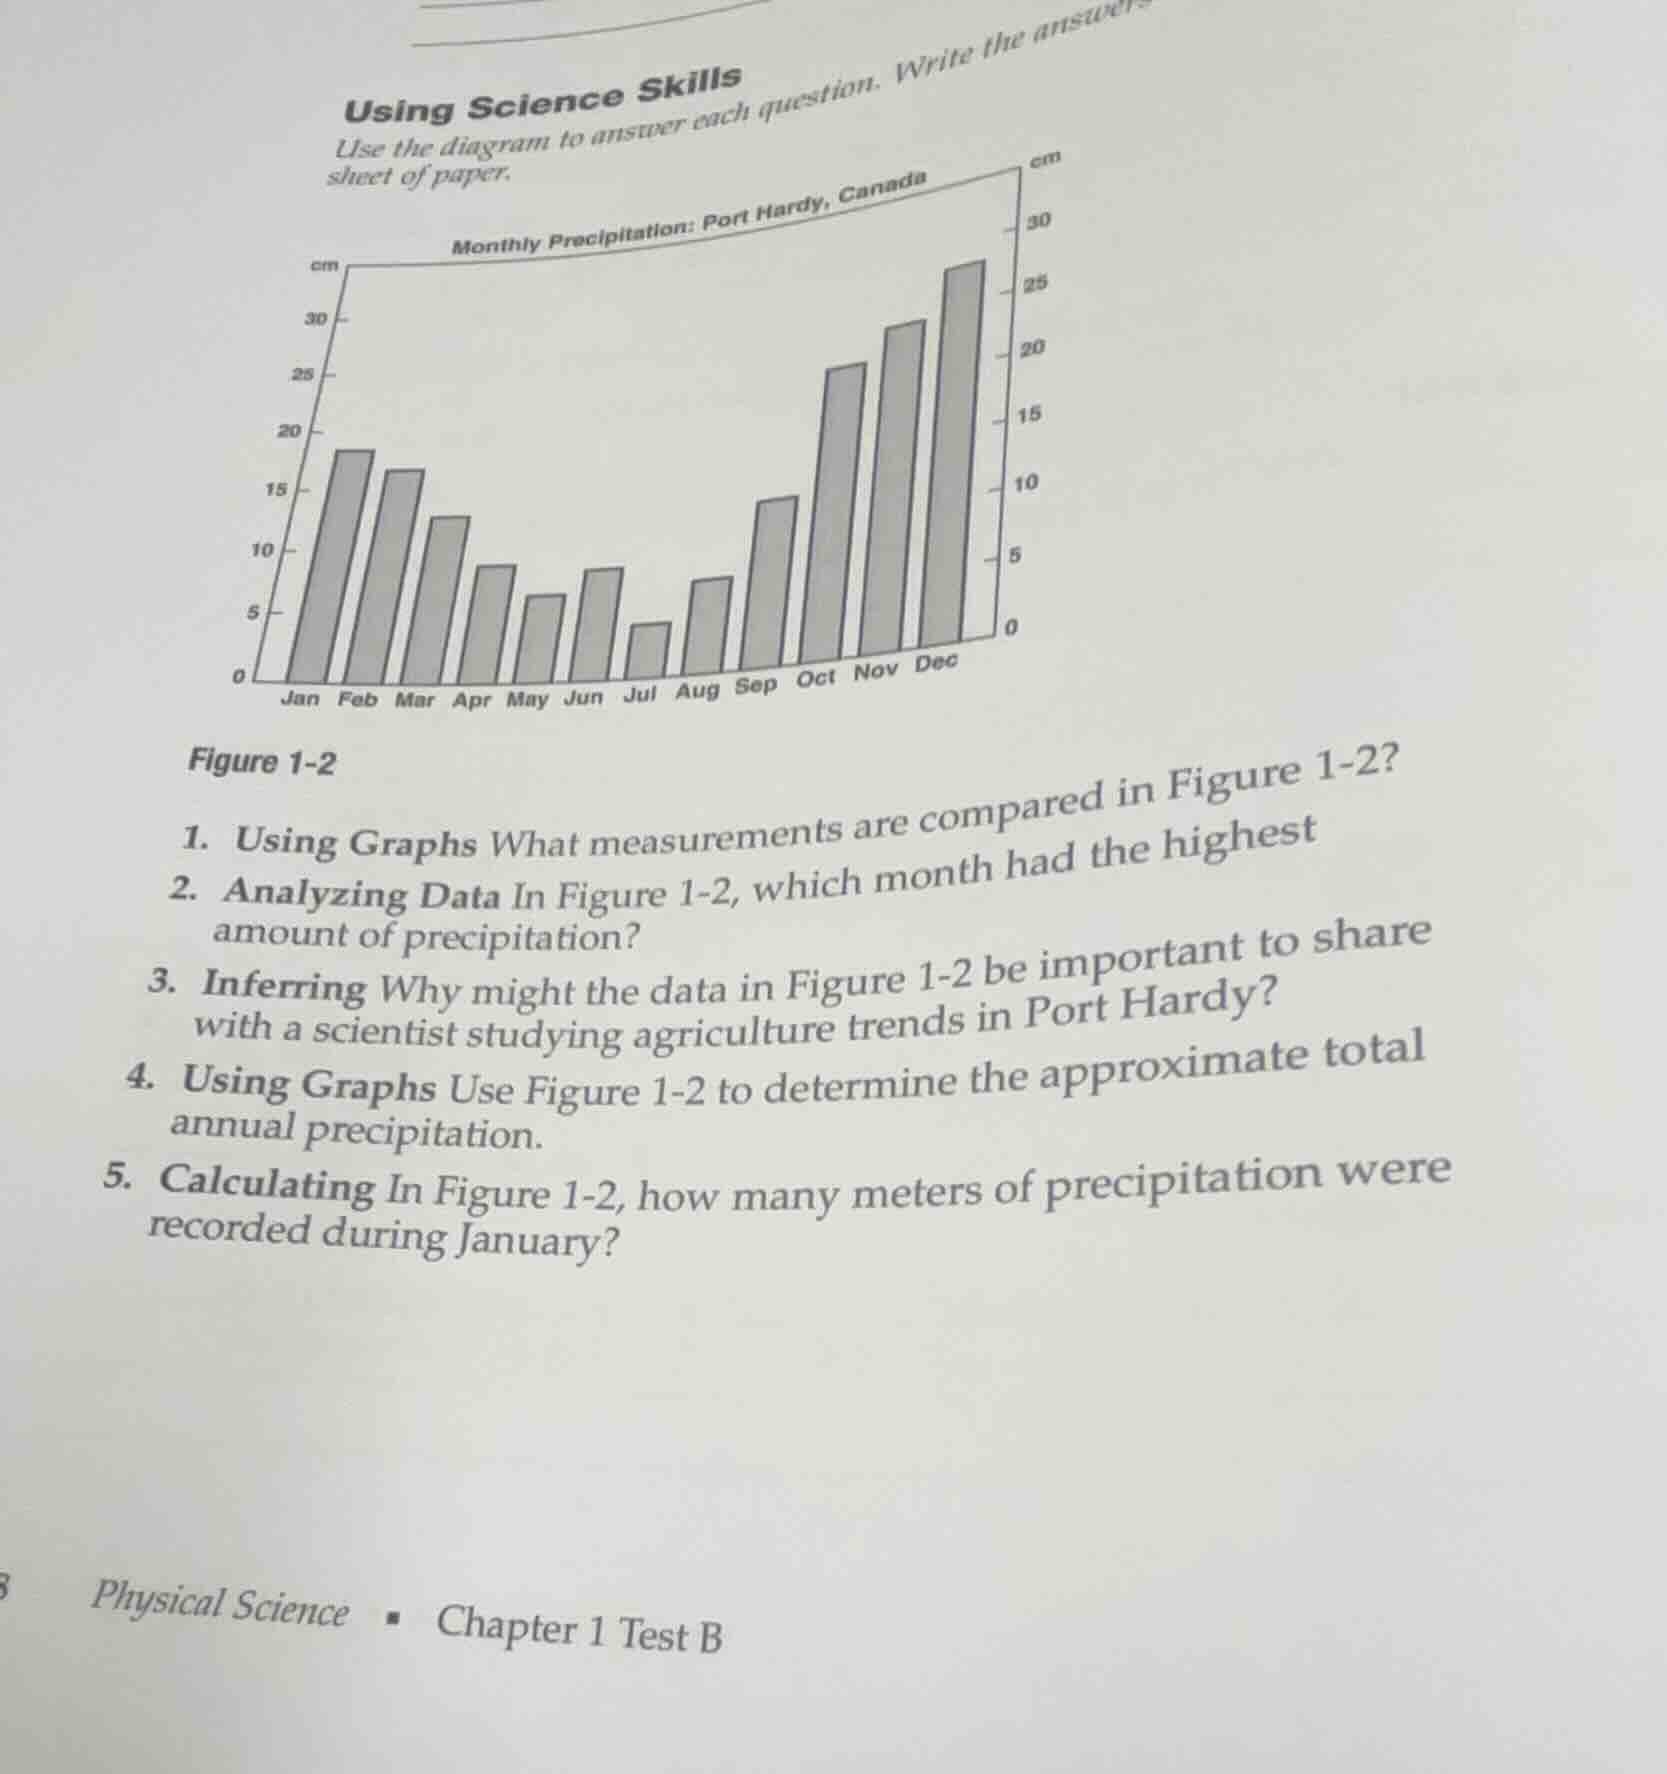
monthly precipitation: port hardy, canada
- using graphs what measurements are compared in figure 1-2?
- analyzing data in figure 1-2, which month had the highest amount of precipitation?
- inferring why might the data in figure 1-2 be important to share with a scientist studying agriculture trends in port hardy?
- using graphs use figure 1-2 to determine the approximate total annual precipitation.
- calculating in figure 1-2, how many meters of precipitation were recorded during january?
Identify variables compared in the graph
The x-axis represents months of the year (time), and the y-axis represents monthly precipitation in centimeters (cm).
Determine highest precipitation month and annual total
The tallest bar is in December, which reaches approximately \(27\text{ cm}\).
Estimating monthly values in cm:
- Jan: \(18\)
- Feb: \(16.5\)
- Mar: \(13\)
- Apr: \(9\)
- May: \(6.5\)
- Jun: \(8.5\)
- Jul: \(4\)
- Aug: \(8\)
- Sep: \(14.5\)
- Oct: \(23.5\)
- Nov: \(25\)
- Dec: \(27\)
Summing these values:
This is approximately \(170\text{ cm}\) (or in the range of \(165\text{ cm}\) to \(175\text{ cm}\)).
Convert January precipitation to meters
January precipitation is \(18\text{ cm}\).

Snap & solve any problem in the app
Get step-by-step solutions on Sovi AI
Photo-based solutions with guided steps
Explore more problems and detailed explanations
Question 1
Monthly precipitation (in centimeters) and months of the year for Port Hardy, Canada.
Question 2
December
Question 3
It helps them understand water availability throughout the year, which is critical for determining planting schedules, crop selection, and irrigation needs.
Question 4
Approximately \(170\text{ cm}\) (acceptable range: \(165\text{ cm}\) to \(175\text{ cm}\)).
Question 5
\(0.18\text{ m}\)