QUESTION IMAGE
Question
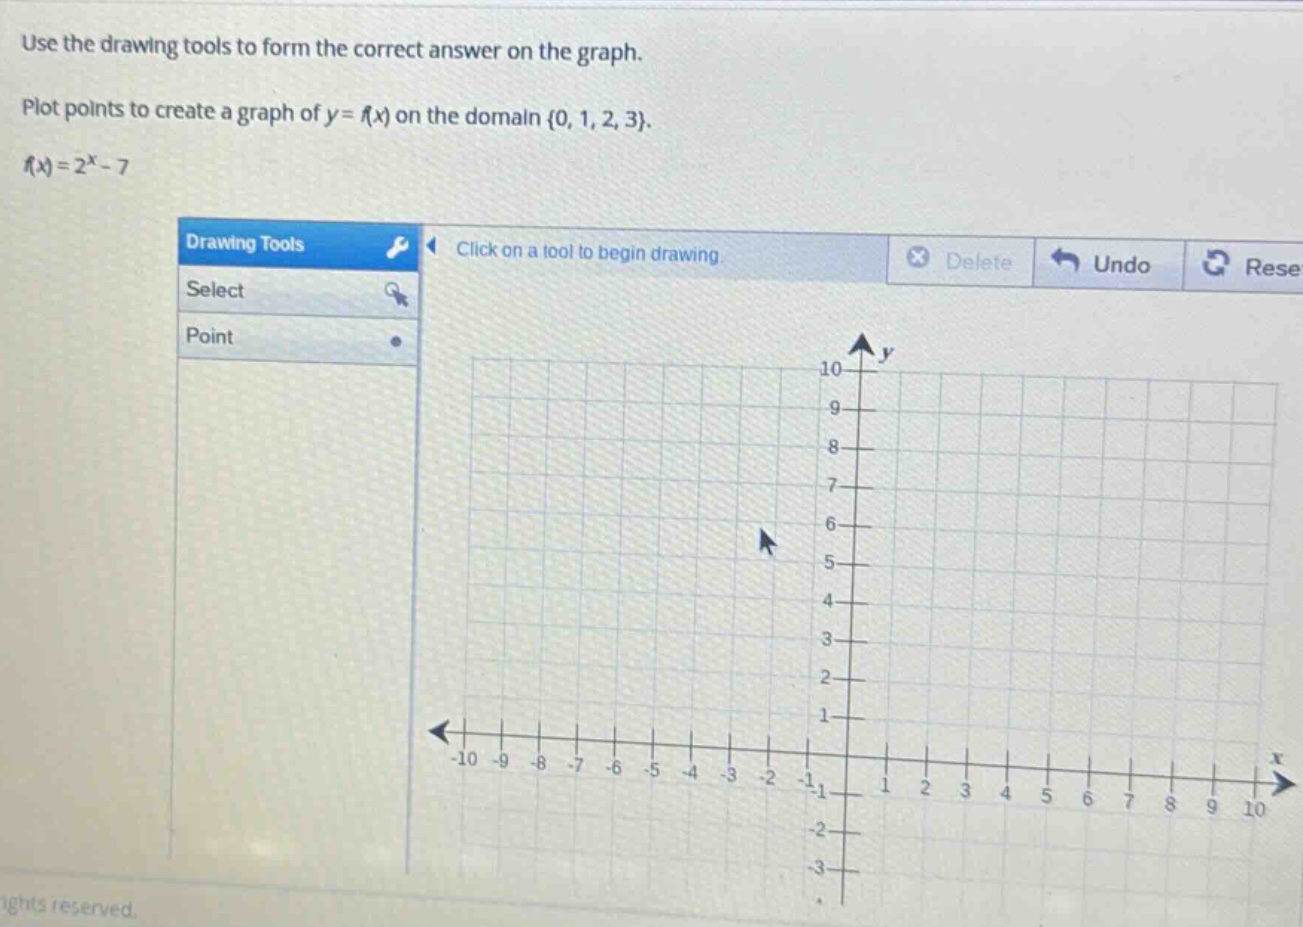
use the drawing tools to form the correct answer on the graph.
plot points to create a graph of (y = f(x)) on the domain (\\{0, 1, 2, 3\\}).
(f(x) = 2^x - 7)
🆕 New Concept Discovered: Graphing Exponential Functions
Plotting discrete points of an exponential curve
Step 1: Understand the domain and function
The function is:
The domain is given as a discrete set of values:
This means we only calculate and plot points for these specific \( x \)-values.
Step 2: Calculate the points
We substitute each \( x \)-value from the domain into the function to find its corresponding \( y \)-value:
- For \( x = 0 \):
Point: \( (0, -6) \)
- For \( x = 1 \):
Point: \( (1, -5) \)
- For \( x = 2 \):
Point: \( (2, -3) \)
- For \( x = 3 \):
Point: \( (3, 1) \)
Step 3: Plot the points on the coordinate plane
Using the point tool, plot the following four discrete points on the graph:
- \( (0, -6) \)
- \( (1, -5) \)
- \( (2, -3) \)
- \( (3, 1) \)
Do not connect the points with a line or curve, because the domain is restricted to only the discrete set \( \{0, 1, 2, 3\} \).

Snap & solve any problem in the app
Get step-by-step solutions on Sovi AI
Photo-based solutions with guided steps
Explore more problems and detailed explanations
The points to plot on the graph are:
- \( (0, -6) \)
- \( (1, -5) \)
- \( (2, -3) \)
- \( (3, 1) \)