QUESTION IMAGE
Question
study the who are americans? infographic about the origins of todays immigrants to the u.s., and then answer the question.
put the regions or countries in order from those representing the lowest percentage of immigrants to the highest.
start by choosing the first item in the sequence and clicking, dragging, or using your keyboard to select it.
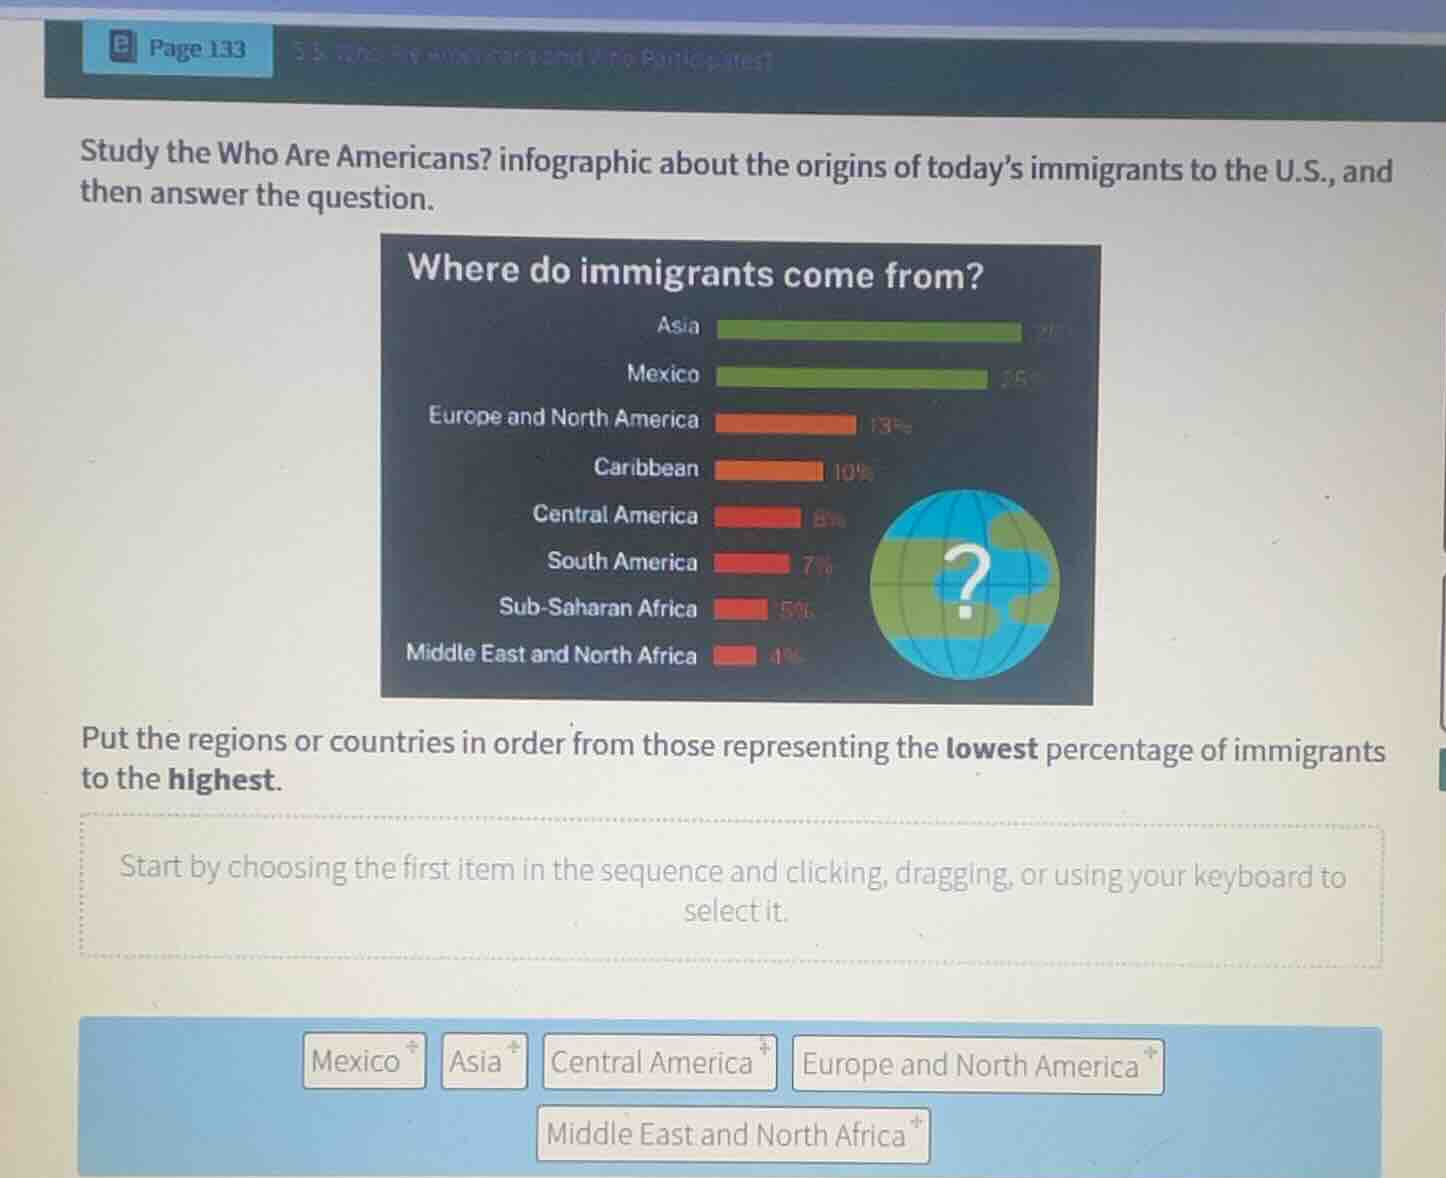
Identify the percentages from the infographic
The infographic shows the following percentages for the relevant regions/countries:
- Asia: \(28\%\)
- Mexico: \(25\%\)
- Europe and North America: \(13\%\)
- Central America: \(8\%\)
- Middle East and North Africa: \(4\%\)
Order from lowest to highest percentage
Sorting the given options from the lowest percentage to the highest percentage:
- Middle East and North Africa (\(4\%\))
- Central America (\(8\%\))
- Europe and North America (\(13\%\))
- Mexico (\(25\%\))
- Asia (\(28\%\))

Snap & solve any problem in the app
Get step-by-step solutions on Sovi AI
Photo-based solutions with guided steps
Explore more problems and detailed explanations
Put the regions or countries in order from those representing the lowest percentage of immigrants to the highest:
- <blank>Middle East and North Africa</blank>
- <blank>Central America</blank>
- <blank>Europe and North America</blank>
- <blank>Mexico</blank>
- <blank>Asia</blank>