QUESTION IMAGE
Question
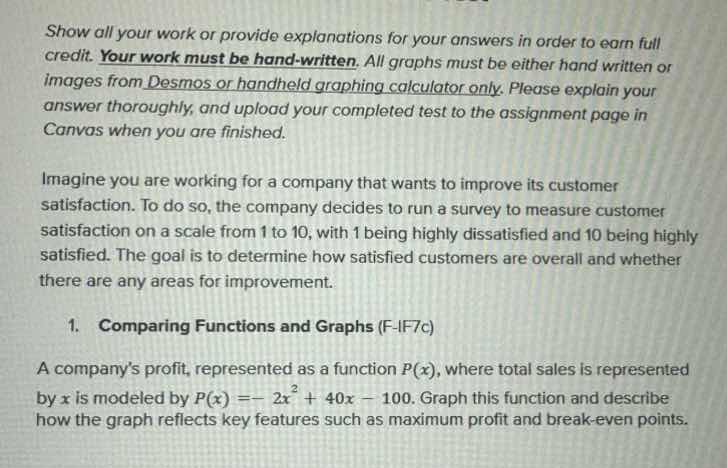
show all your work or provide explanations for your answers in order to earn full credit. your work must be hand-written. all graphs must be either hand written or images from desmos or handheld graphing calculator only. please explain your answer thoroughly, and upload your completed test to the assignment page in canvas when you are finished.
imagine you are working for a company that wants to improve its customer satisfaction. to do so, the company decides to run a survey to measure customer satisfaction on a scale from 1 to 10, with 1 being highly dissatisfied and 10 being highly satisfied. the goal is to determine how satisfied customers are overall and whether there are any areas for improvement.
- comparing functions and graphs (f-if7c)
a companys profit, represented as a function (p(x)), where total sales is represented by (x) is modeled by (p(x) = -2x^2 + 40x - 100). graph this function and describe how the graph reflects key features such as maximum profit and break-even points.
Find the vertex for maximum profit
Find the break-even points
Identify key features of the graph

Snap & solve any problem in the app
Get step-by-step solutions on Sovi AI
Photo-based solutions with guided steps
Explore more problems and detailed explanations
The quadratic profit function is \(P(x) = -2x^2 + 40x - 100\).
- Maximum Profit: The vertex of the parabola is at \((10, 100)\), which means the maximum profit is \(100\) units when total sales \(x = 10\).
- Break-Even Points: The \(x\)-intercepts where profit is zero (\(P(x) = 0\)) occur at \(x = 10 \pm 5\sqrt{2}\). This corresponds to sales of approximately \(2.93\) and \(17.07\) units.
- Graph Behavior: The graph is a parabola opening downwards (since the leading coefficient is \(-2\)), with a \(y\)-intercept at \((0, -100)\), representing a fixed loss of \(100\) when sales are zero.