QUESTION IMAGE
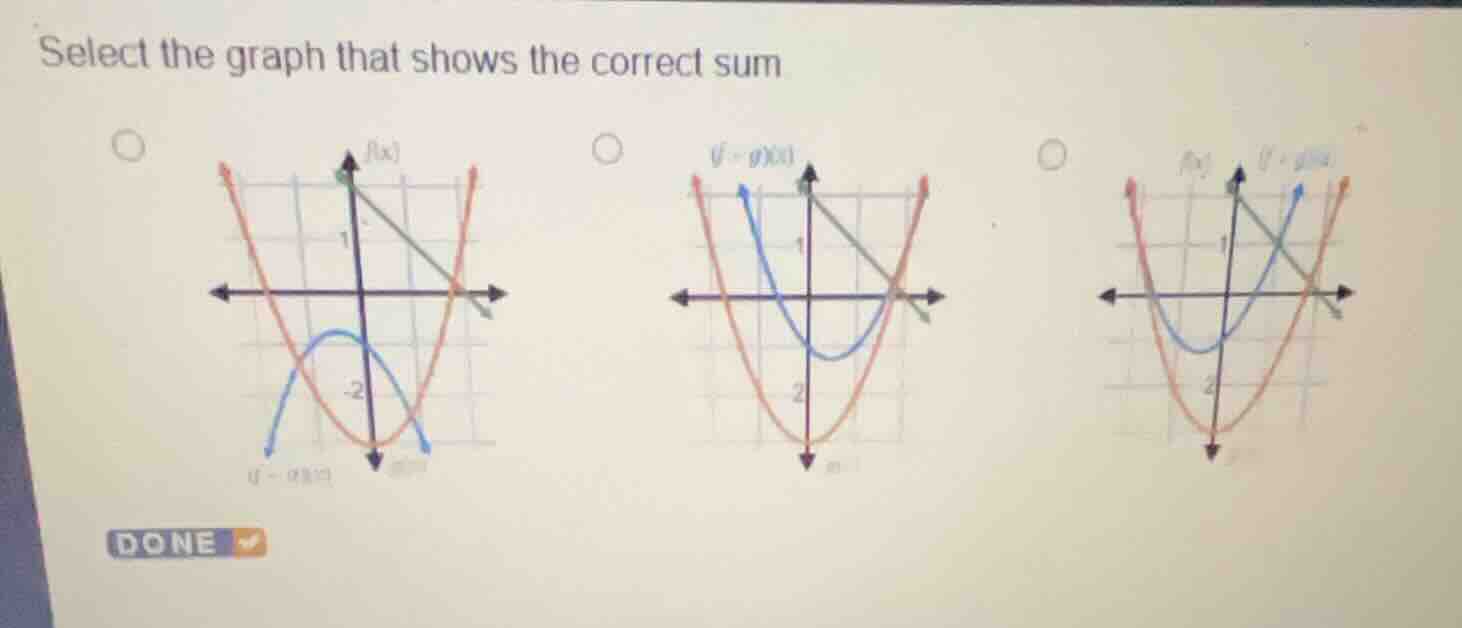
Question
select the graph that shows the correct sum
Identify key points of the given functions
From the graphs, we observe two base functions:
- A linear function \(f(x)\) passing through \((0, 2)\) and \((2, 0)\), so \(f(x) = -x + 2\).
- A quadratic function \(g(x)\) with its vertex at \((0, -3)\) and passing through \((2, 1)\) and \((-2, 1)\), so \(g(x) = x^2 - 3\).
Calculate the sum function
$$
(f+g)(x) = f(x) + g(x) = (-x + 2) + (x^2 - 3) = x^2 - x - 1
$$
Evaluate key points of the sum function
- At \(x = 0\): \((f+g)(0) = -1\)
- At \(x = 1\): \((f+g)(1) = -1\)
- At \(x = 2\): \((f+g)(2) = 1\)
- At \(x = -1\): \((f+g)(-1) = 1\)
Comparing this with the options:
- Option 1 shows the sum curve (blue) with a vertex below \(y = -1\) and opening downwards, which is incorrect.
- Option 2 shows the sum curve (blue) passing through \((0, -1)\) and \((1, -1)\), opening upwards, which matches our calculated points.
- Option 3 shows the sum curve (blue) with a vertex above \(y = -1\), which is incorrect.

Snap & solve any problem in the app
Get step-by-step solutions on Sovi AI
Photo-based solutions with guided steps
Explore more problems and detailed explanations
- (A) First graph (sum curve opening downwards)
- (B) Second graph (sum curve opening upwards with y-intercept at -1) (Correct answer)
- (C) Third graph (sum curve shifted higher)