QUESTION IMAGE
Question
select the correct answer from each drop-down menu.
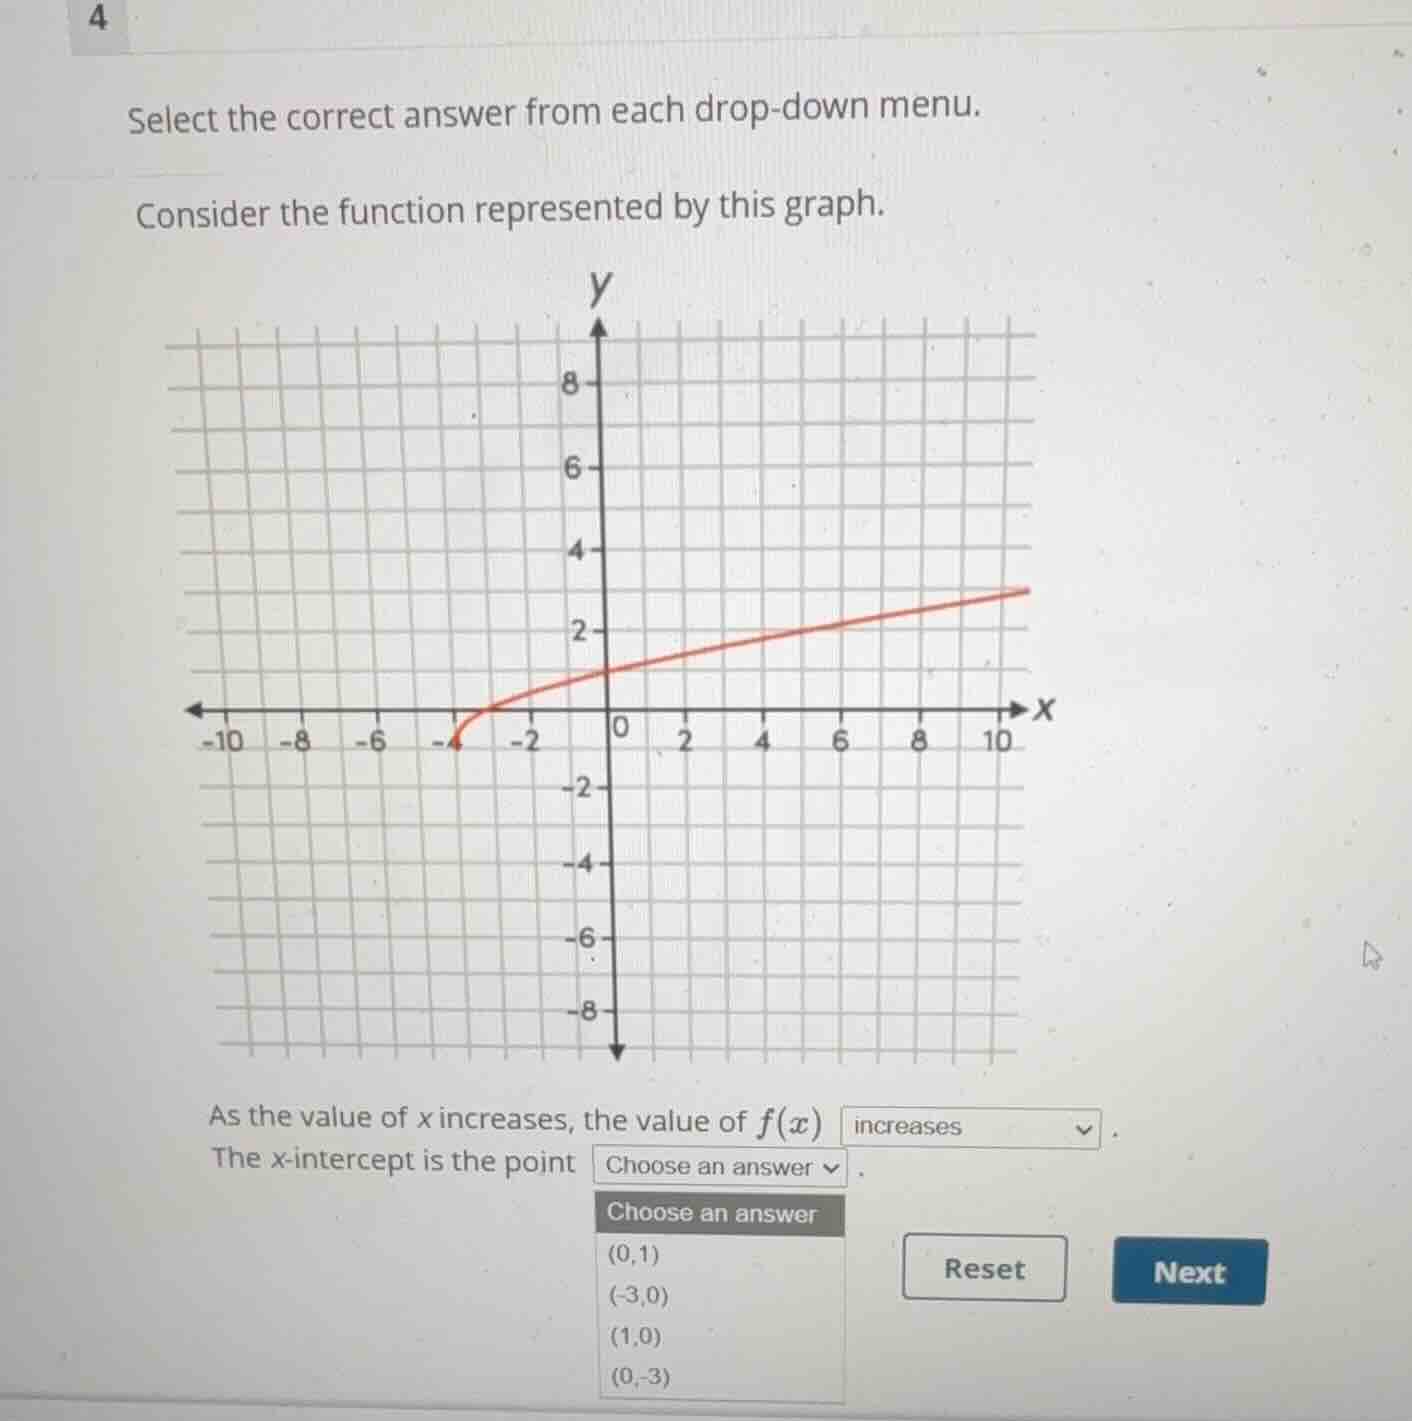
consider the function represented by this graph.
as the value of \\(x\\) increases, the value of \\(f(x)\\) increases.
the \\(x\\)-intercept is the point choose an answer.
choose an answer:
(0,1)
(-3,0)
(1,0)
(0,-3)
Analyze the behavior of the function as x increases
$$
\text{As } x \text{ moves from left to right } (-3 \to 10), \text{ the curve rises vertically from } y = 0 \text{ to } y = 3.
$$
$$
\text{Therefore, as } x \text{ increases, } f(x) \text{ increases.}
$$
Identify the x-intercept from the graph and options
$$
\text{The x-intercept is the point where the graph crosses the x-axis } (y = 0).
$$
$$
\text{Looking at the graph, the curve starts on the x-axis at } x = -3.
$$
$$
\text{The coordinates of this point are } (-3, 0).
$$

Snap & solve any problem in the app
Get step-by-step solutions on Sovi AI
Photo-based solutions with guided steps
Explore more problems and detailed explanations
Question 1
As the value of \(x\) increases, the value of \(f(x)\) <blank>increases</blank>.
Question 2
The x-intercept is the point <blank>\((-3,0)\)</blank>.