QUESTION IMAGE
Question
select all the correct answers.
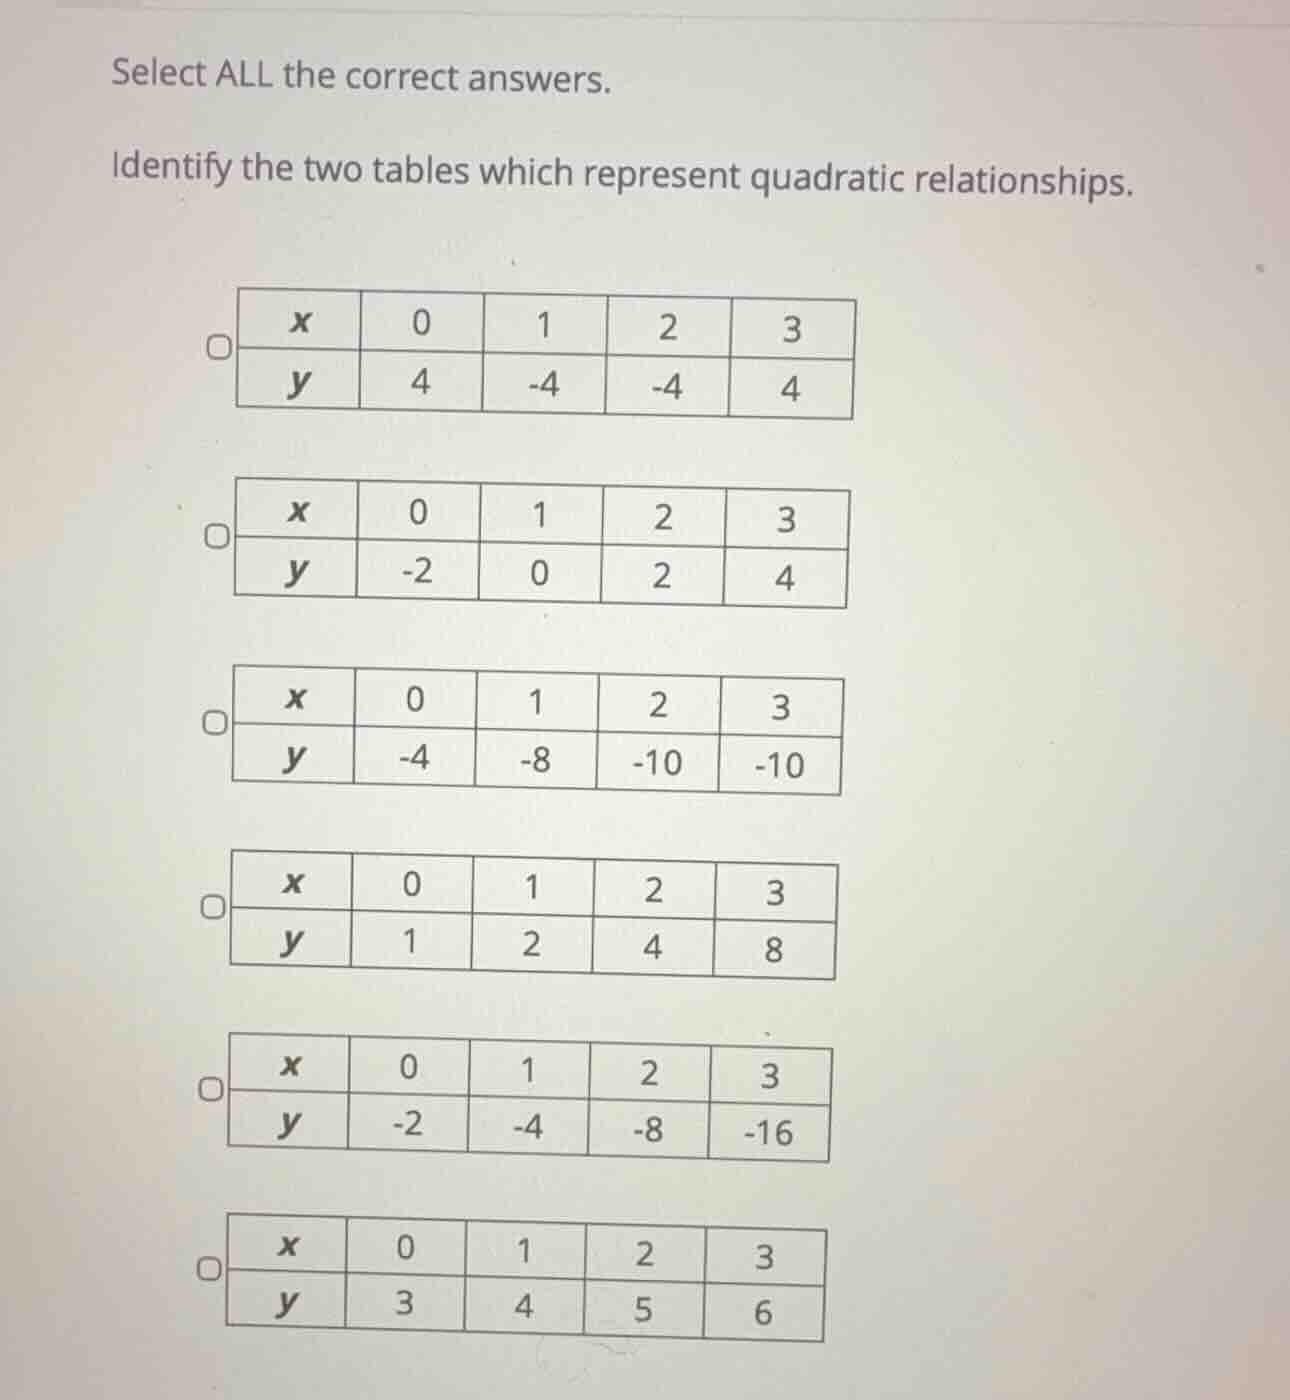
identify the two tables which represent quadratic relationships.
\
\
\
\
\
\
Analyze differences for each table
Calculate the first differences (\(\Delta y\)) and second differences (\(\Delta^2 y\)) for each table where \(x\) increases by \(1\).
- Table 1:
\(y\)-values: \(4, -4, -4, 4\)
First differences: \(-4 - 4 = -8\), \(-4 - (-4) = 0\), \(4 - (-4) = 8\)
Second differences: \(0 - (-8) = 8\), \(8 - 0 = 8\)
Since second differences are constant (\(8\)), this is quadratic.
- Table 2:
\(y\)-values: \(-2, 0, 2, 4\)
First differences: \(2, 2, 2\)
Since first differences are constant, this is linear.
- Table 3:
\(y\)-values: \(-4, -8, -10, -10\)
First differences: \(-8 - (-4) = -4\), \(-10 - (-8) = -2\), \(-10 - (-10) = 0\)
Second differences: \(-2 - (-4) = 2\), \(0 - (-2) = 2\)
Since second differences are constant (\(2\)), this is quadratic.
- Table 4:
\(y\)-values: \(1, 2, 4, 8\)
Ratios: \(\frac{2}{1} = 2\), \(\frac{4}{2} = 2\), \(\frac{8}{4} = 2\)
Since the ratio is constant, this is exponential.
- Table 5:
\(y\)-values: \(-2, -4, -8, -16\)
Ratios: \(2, 2, 2\)
Since the ratio is constant, this is exponential.
- Table 6:
\(y\)-values: \(3, 4, 5, 6\)
First differences: \(1, 1, 1\)
Since first differences are constant, this is linear.
Identify the quadratic tables
The tables representing quadratic relationships are Table 1 and Table 3.

Snap & solve any problem in the app
Get step-by-step solutions on Sovi AI
Photo-based solutions with guided steps
Explore more problems and detailed explanations
- Table 1: x = [0, 1, 2, 3], y = [4, -4, -4, 4] (Correct answer)
- Table 2: x = [0, 1, 2, 3], y = [-2, 0, 2, 4]
- Table 3: x = [0, 1, 2, 3], y = [-4, -8, -10, -10] (Correct answer)
- Table 4: x = [0, 1, 2, 3], y = [1, 2, 4, 8]
- Table 5: x = [0, 1, 2, 3], y = [-2, -4, -8, -16]
- Table 6: x = [0, 1, 2, 3], y = [3, 4, 5, 6]