QUESTION IMAGE
Question
question
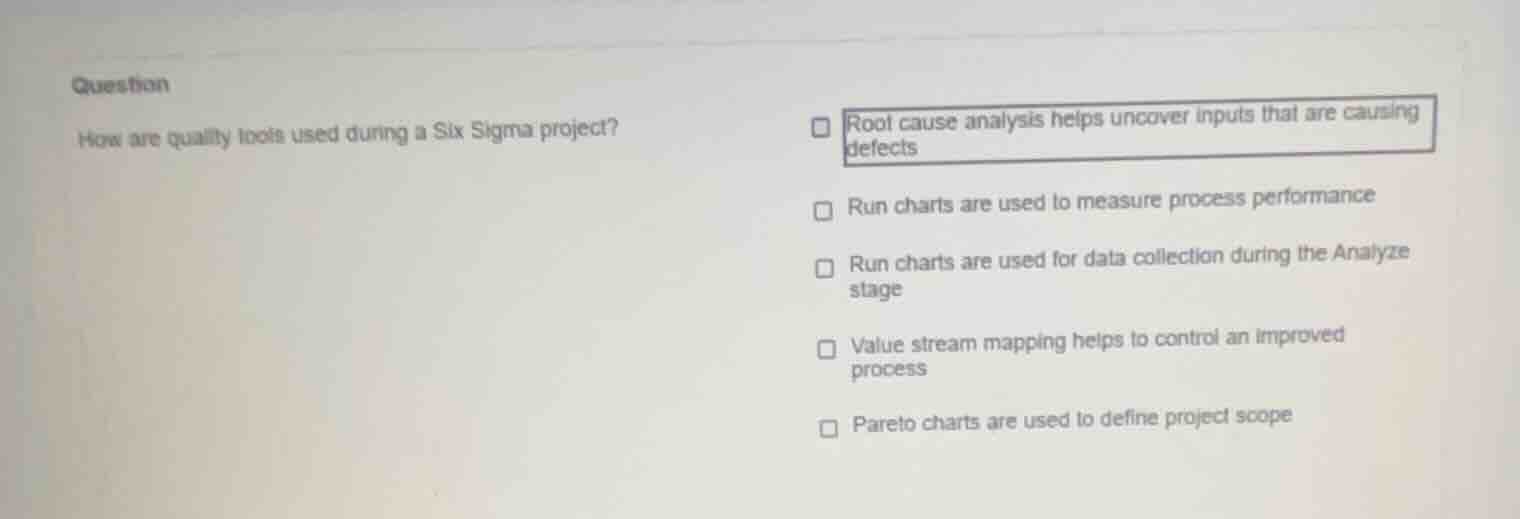
how are quality tools used during a six sigma project?
- root cause analysis helps uncover inputs that are causing defects
- run charts are used to measure process performance
- run charts are used for data collection during the analyze stage
- value stream mapping helps to control an improved process
- pareto charts are used to define project scope
Analyze the question and options
The question asks: "How are quality tools used during a Six Sigma project?" We need to evaluate each of the provided statements to find the correct description of how these tools function within the DMAIC (Define, Measure, Analyze, Improve, Control) framework of Six Sigma.
Evaluate the first option
The first option states: "Root cause analysis helps uncover inputs that are causing defects."
- Root Cause Analysis is a fundamental method used during the Analyze phase of a Six Sigma project.
- Its primary purpose is to identify the underlying factors (inputs or process variables, often denoted as \(X\)'s in the \(Y = f(X)\) relationship) that lead to undesirable outcomes or defects (\(Y\)).
- This statement is conceptually accurate and aligns perfectly with the core principles of Six Sigma Tools.
Evaluate the remaining options
Let's review why the other options are incorrect or less accurate:
- "Run charts are used to measure process performance": While run charts show data trends over time, they are primarily used to monitor process stability and detect patterns rather than serving as the primary tool to establish baseline capability or measure overall performance metrics.
- "Run charts are used for data collection during the Analyze stage": Run charts are graphical tools used to display data over time, not tools designed for the collection of data itself. Data collection occurs primarily in the Measure stage.
- "Value stream mapping helps to control an improved process": Value stream mapping is typically used in the Define or Measure stages to visualize the current state and identify waste, not as a primary tool in the Control stage.
- "Pareto charts are used to define project scope": Pareto charts help prioritize problems by identifying the "vital few" sources of defects, but they do not define the overall project scope (which is done via a Project Charter).

Snap & solve any problem in the app
Get step-by-step solutions on Sovi AI
Photo-based solutions with guided steps
Explore more problems and detailed explanations
- Root cause analysis helps uncover inputs that are causing defects (Correct answer)
- Run charts are used to measure process performance
- Run charts are used for data collection during the Analyze stage
- Value stream mapping helps to control an improved process
- Pareto charts are used to define project scope